Tom Abel and Matthew Turk of the Kavli Institute for Particle Astrophysics and Cosmology at Stanford University, and Greg Bryan of Columbia University perform some of the most detailed simulations of the formation of the first stars. They use a computer code that allows them to use more detail in areas that require more detail — for example, the location of the first star. In order to see what is going on in the densest, hottest area, the astrophysicists use more resolution “elements” in that particular area.
With this approach, they can better analyze the formation of the first star, and zoom in multiple times — by a factor of between 2^25 and 2^34 in some of the simulations. This means they don’t have to spend computing power on regions where structures and stars are not forming. Additionally, they can choose where to zoom in during the course of a simulation.
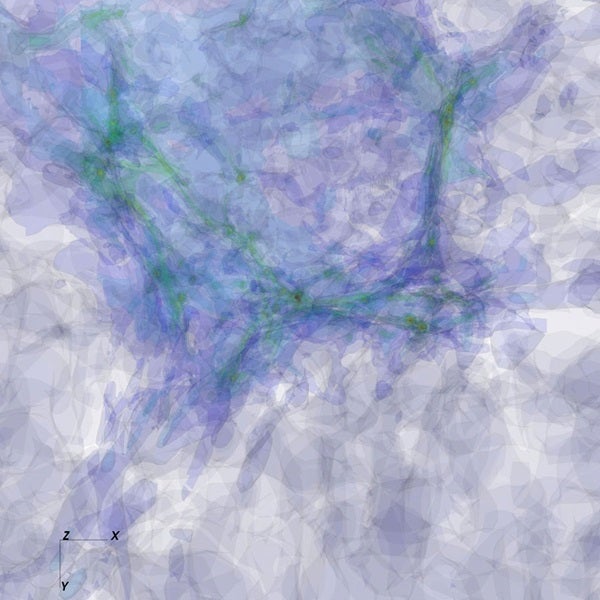
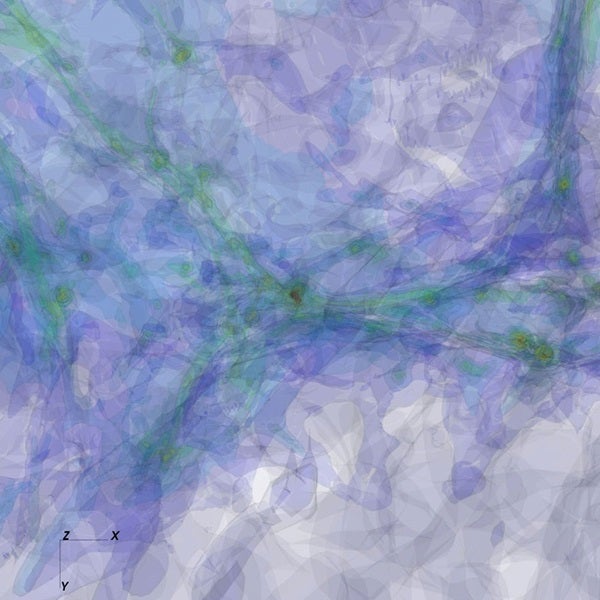
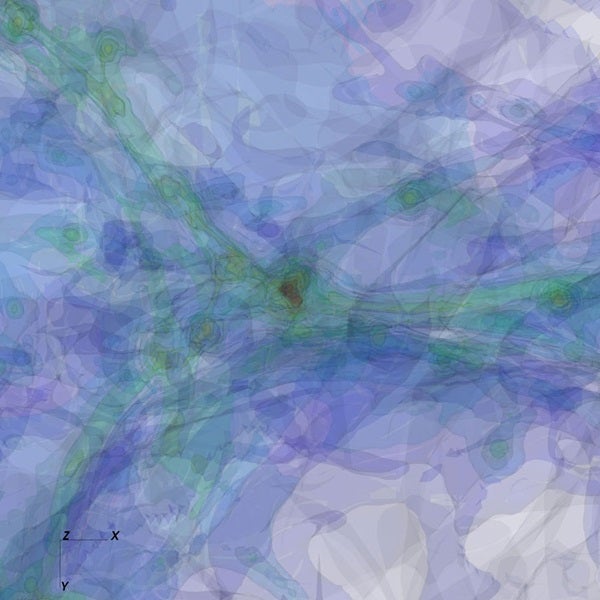
A zoom-in sequence of one of the first star’s formation is shown in the following images. Colors correspond to different gas densities, forming contours of constant density. The highest density, and hottest temperature, is red in these images; the lowest density, and coolest temperature, is dark blue.
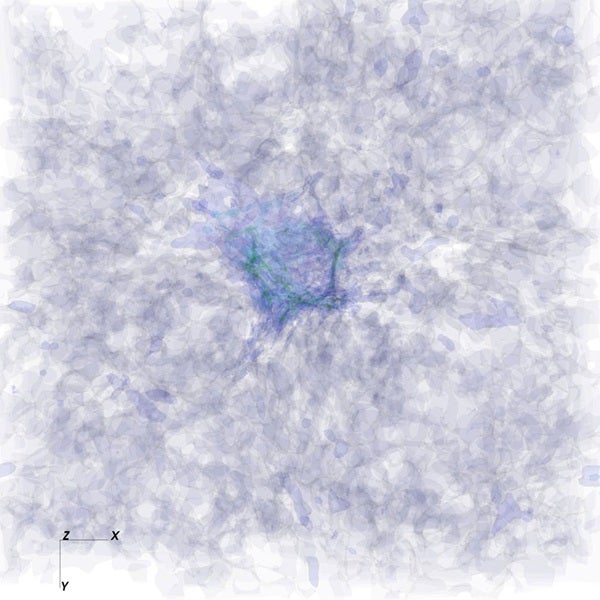
Simulations and visualization by Matthew Turk, Tom Abel (KIPAC, Stanford), and Greg Bryan (Columbia)
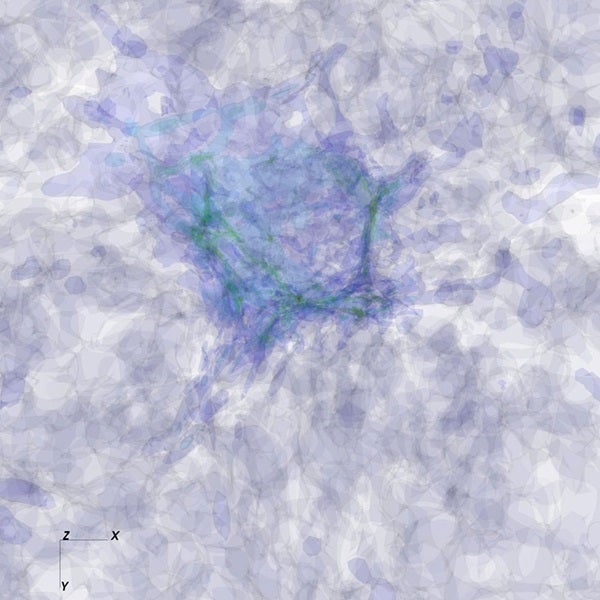
Simulations and visualization by Matthew Turk, Tom Abel (KIPAC, Stanford), and Greg Bryan (Columbia)
Simulations and visualization by Matthew Turk, Tom Abel (KIPAC, Stanford), and Greg Bryan (Columbia)
Simulations and visualization by Matthew Turk, Tom Abel (KIPAC, Stanford), and Greg Bryan (Columbia)
Simulations and visualization by Matthew Turk, Tom Abel (KIPAC, Stanford), and Greg Bryan (Columbia)