At the beginning of the 20th century, astronomers thought the Milky Way encompassed the entire universe. During the past century, as astronomical understanding has raced ahead to decipher the evolution of stars, other galaxies, and the universe itself, the Milky Way has given up its secrets only grudgingly.
Because the galaxy surrounds us, understanding its structure entails observing a large fraction of the sky. In the past, this required decades of data collection and analysis. Now, thanks to advances in detector technology, analysis software, and computing power, it has become feasible to complete such surveys in a few years.
On August 25, 2003, NASA launched the Spitzer Space Telescope on a mission to study the universe in infrared wavelengths. Three years prior to Spitzer’s launch, NASA chose six large observing programs — dubbed “Legacy” projects — after a worldwide call for proposals. One of these, the Galactic Legacy Infrared Mid-Plane Survey Extraordinaire (GLIMPSE), surveys the Milky Way in four infrared spectral ranges.
GLIMPSE-ing the sky
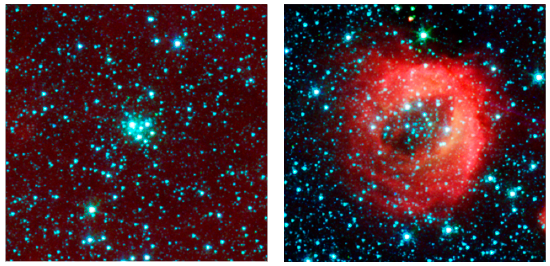
The area covered by GLIMPSE contains most of the galaxy’s star-forming regions and about 70 percent of its molecular gas. The GLIMPSE team focuses on two questions: What do the distribution of stars and infrared-bright star-formation regions tell us about the inner galaxy’s structure, including the disk, molecular ring, number and location of spiral arms, and central bar? What are the physics of star formation as a function of mass, stage of evolution, and location in the Milky Way?
The problem with star counts
When it comes to determining the distribution of stars in the Milky Way, the most straightforward technique is simply to count stars. English astronomer William Herschel (1738–1822) introduced this technique in 1765. Historically, however, star counting has led to some of the most famous wrong answers in astronomy.
Imagine we live in a galaxy comprising a disk of stars (we do), and that we are about halfway from the center to the edge (we are). As we scan its plane, we should see the most stars when we look toward the galaxy’s center (we don’t). By looking at how quickly the number of stars declines as we scan away from the galaxy’s center, astronomers should be able to determine how the stellar density decreases (we can’t). When we look in directions for which our line of sight skims tangent to a spiral arm, we should see an excess of stars compared to nearby directions (we don’t).
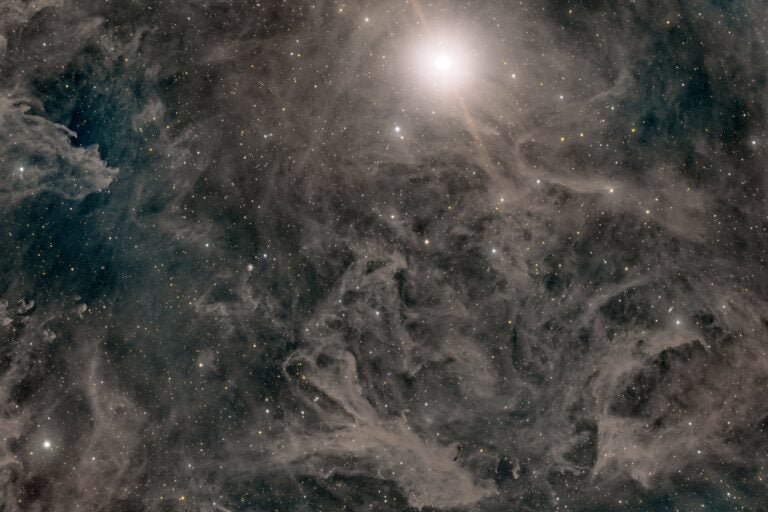
What’s wrong? The answer is one of the unpleasant four-letter words of astronomy: dust. Although the density of dust (and gas) in interstellar space is nearly nothing, space is vast, and a whole lot of nearly nothing adds up to something.
What effect does dust have? Imagine watching a terrestrial sunset. The Sun reddens and dims as it approaches the horizon. This impairs your ability to measure the Sun’s true color and brightness.
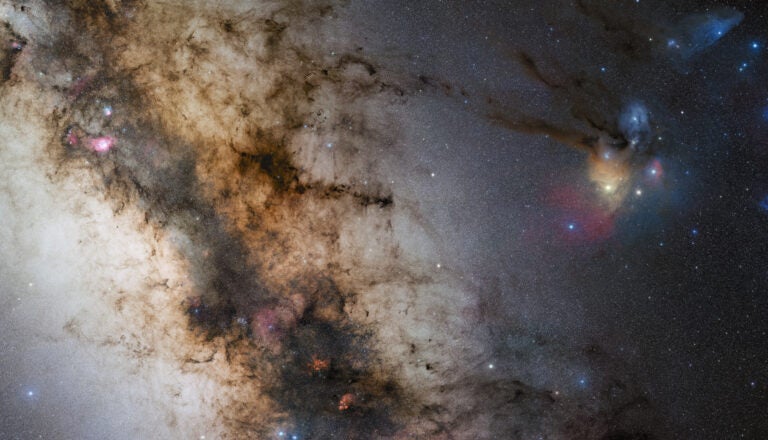
In interstellar space, the Milky Way’s dust is not evenly distributed but occurs in clumps and clouds. A few “holes” exist through which astronomers can observe stars to great distances. One such area, called Baade’s Window, named for German-born American astronomer Walter Baade (1893–1960), allows a view of the Milky Way’s central bulge. But for most of the galaxy’s inner disk, dust is a showstopper — a barrier to understanding the distribution of stars there.
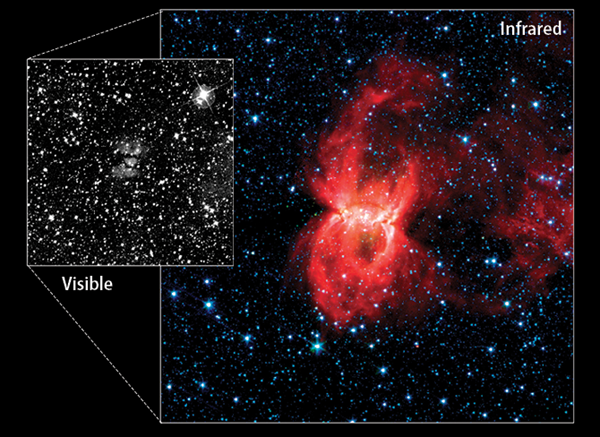
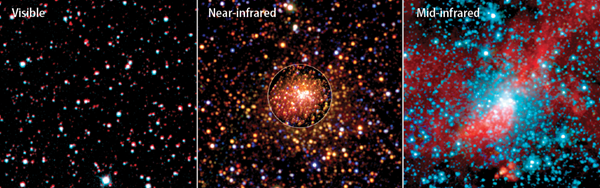
Through the dust
The barrier began to crumble with the advent of sensitive infrared detectors. Because infrared light penetrates dust more readily than visible light, an infrared view of the galaxy reveals more stars. The Diffuse Infrared Background Experiment aboard the Cosmic Background Explorer (COBE), launched in 1989, could not resolve individual stars. However, several groups analyzed the light distribution and found evidence for a central stellar bar in our galaxy. Now, using the unprecedented sensitivity of the Spitzer Space Telescope, astronomers can study the galaxy at the same wavelengths but with enough angular resolution to observe individual stars
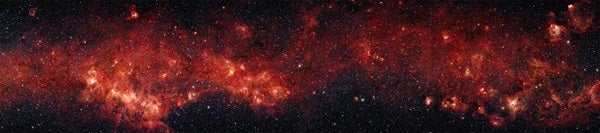
Using the Infrared Array Camera, the GLIMPSE Legacy team, led by Ed Churchwell of the University of Wisconsin–Madison, surveyed a 130°-long strip stretching 1° above and below the galactic plane. This strip contains most of the galaxy’s stars. Unfortunately, it also contains most of the dust. The project’s goals were to take a stellar census of the galaxy and study star formation.
The team’s stellar census is complete. It produced a catalog of more than 40 million sources in four different wavelengths. Scientists expect more than 90 percent of these sources to be red giant stars. Because red giants are so luminous, they can be seen from large distances across the galaxy. Although dense regions of dust still block our view, even in the mid-infrared, one of the pleasant results of this survey is that the star-counting technique actually works.
By counting stars as a function of direction and brightness, GLIMPSE found the long-expected result that the number of stars increases all the way to the galactic center.
This enables astronomers to measure the radial “scale length” of the galaxy — the distance one has to go from the center for the stellar density to drop by a factor of nearly two. By determining this number and studying how the galaxy’s rotation speed varies at different radii, astronomers can infer how much of the inner galaxy is in the form of dark matter (matter that neither emits nor reflects enough radiation to be detected).
Raising the bar
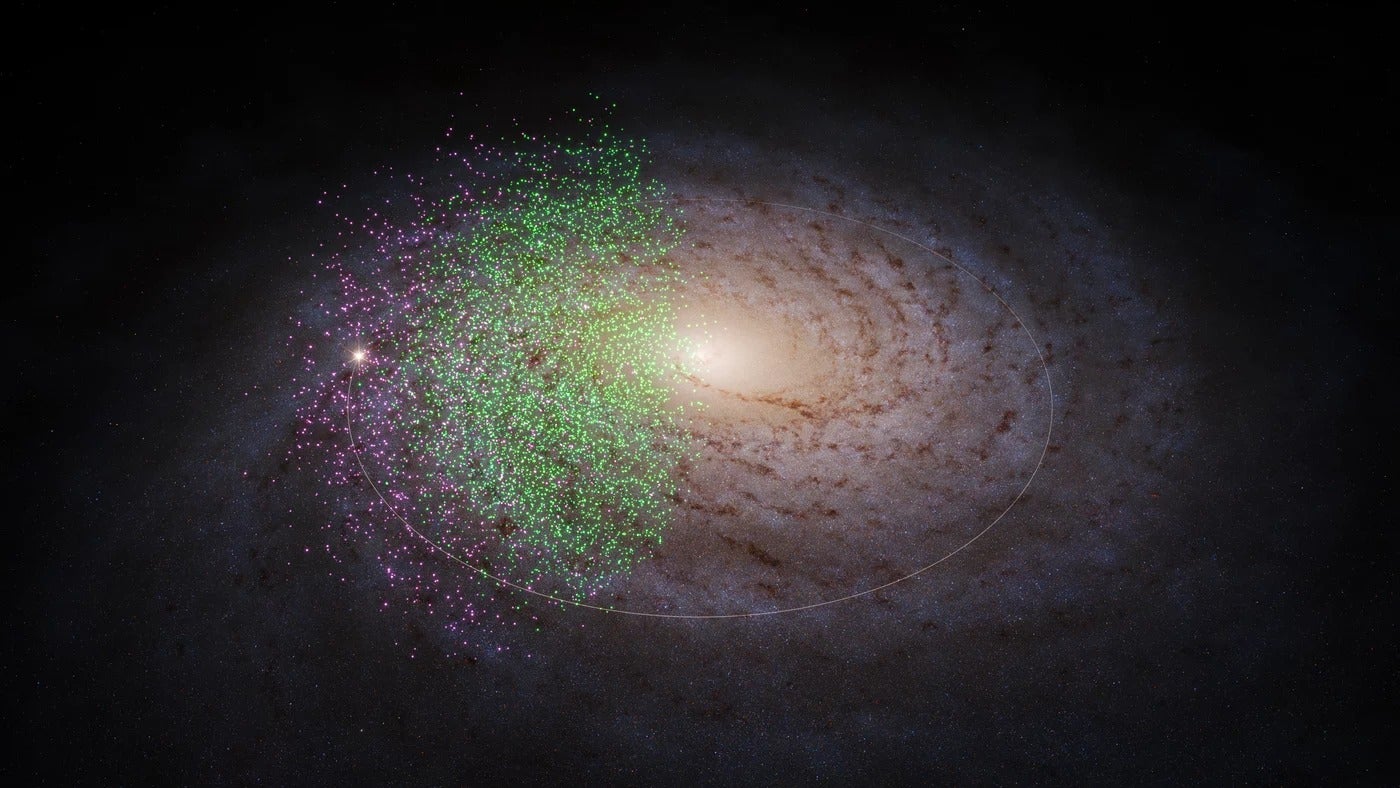
GLIMPSE also has shed light on two of the major structural features of our Milky Way. First, astronomers counted the number of stars at equal angles to the left and right of the galactic center and examined their brightnesses. These GLIMPSE data confirmed the galaxy has a long stellar bar. This bar is characterized by an excess population of stars called “red giant clump” stars. These stars, which shine with a fixed luminosity, were used as “standard candles” to pin down the bar’s angle and length. Although other astronomers observed the bar, the sensitivity and full coverage of GLIMPSE provided a dramatic confirmation of the bar’s structure.
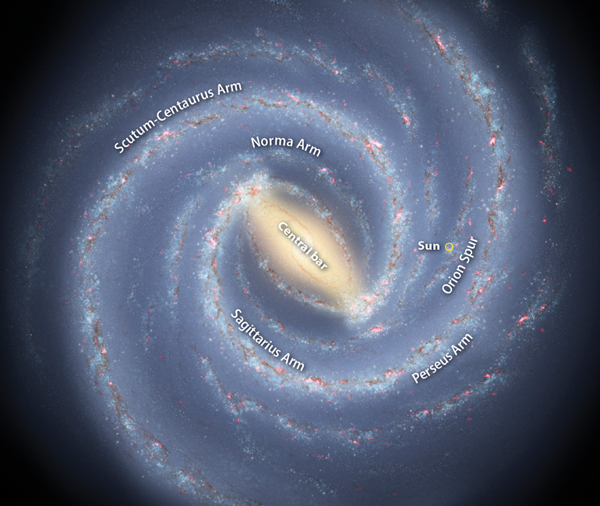
The second surprise lurking in GLIMPSE star counts concerned our galaxy’s spiral structure. The survey’s outer regions contained two areas where astronomers expected to see an excess of stars because our line of sight skims along spiral arms at these points. One of these arms, the Scutum-Centaurus Arm, shows a dramatic enhancement of stars in the direction expected from studies of star-forming regions in optical and radio wavelengths. But the second region, the Sagittarius Arm tangency, shows no strong evidence for such an enhancement. This is despite the fact that both tangencies are approximately the same distance from the Sun.
Although the Sagittarius Arm is clearly a major star-forming structure, it lacks any evidence of compression in the older stellar populations. Ron Drimmel and David Spergel of Princeton University first found this using COBE data. Astronomers have noted this characteristic in other spiral galaxies as well because infrared light traces the old stellar populations (and most of a galaxy’s stellar mass), while visible light traces recent star formation. It sometimes happens that spiral galaxies show secondary star-forming compressions between the major infrared arms. Is our galaxy such a case? Time and future study will tell.