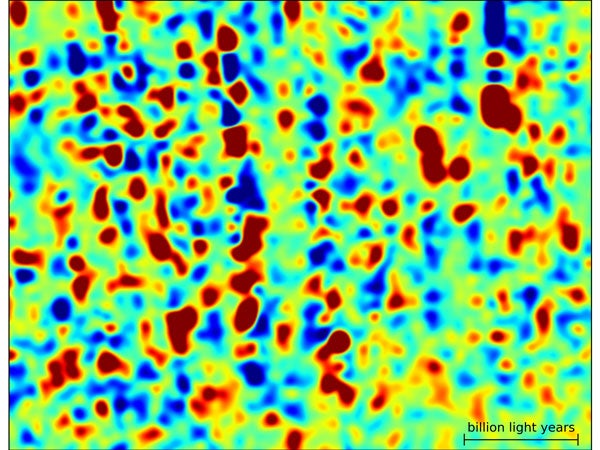
The new technique used by Anze Slosar from the U.S. Department of Energy’s Brookhaven National Laboratory and his colleagues turns the standard approach of astronomy on its head. “Usually we make our maps of the universe by looking at galaxies, which emit light,” Slosar said. “But here, we are looking at intergalactic hydrogen gas, which blocks light. It’s like looking at the Moon through clouds — you can see the shapes of the clouds by the moonlight that they block.”
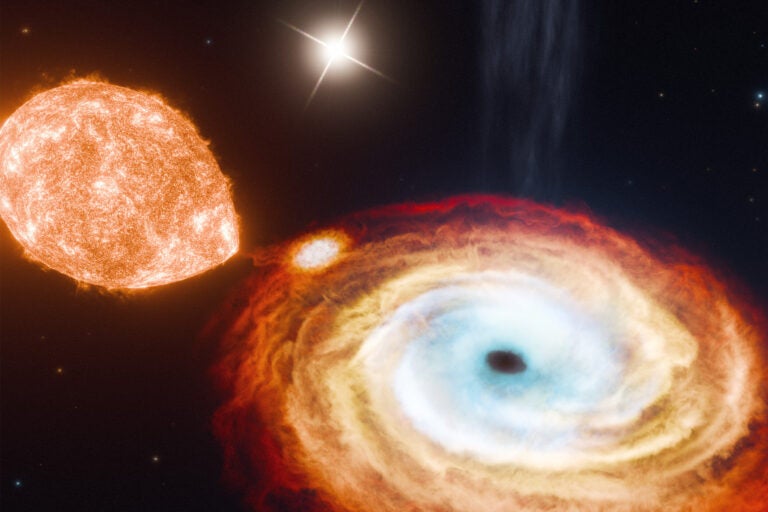
Instead of the Moon, the SDSS team observed quasars, brilliantly luminous beacons powered by giant black holes. Quasars are bright enough to be seen billions of light-years from Earth, but at these distances they look like tiny, faint points of light. As light from a quasar travels on its long journey to Earth, it passes through clouds of intergalactic hydrogen gas that absorb light at specific wavelengths, which depend on the distances to the clouds. This patchy absorption imprints an irregular pattern on the quasar light known as the “Lyman-alpha forest.”
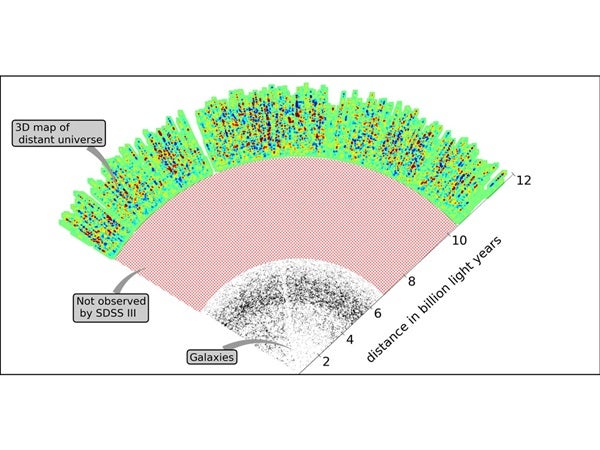
An observation of a single quasar gives a map of the hydrogen in the direction of the quasar, Slosar said. The key to making a full, three-dimensional map is numbers. “When we use moonlight to look at clouds in the atmosphere, we only have one Moon. But if we had 14,000 Moons all over the sky, we could look at the light blocked by clouds in front of all of them, much like what we can see during the day. You don’t just get many small pictures — you get the big picture.”
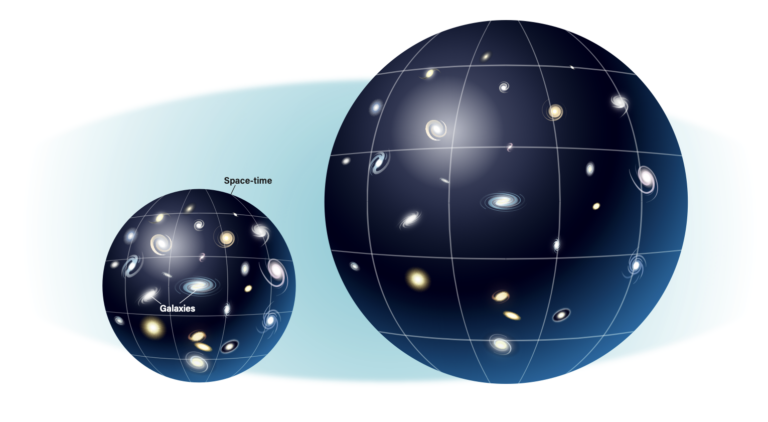
The big picture shown in Slosar’s map contains important clues to the history of the universe. The map shows a time 11 billion years ago when the first galaxies were just starting to come together under the force of gravity to form the first large clusters. As the galaxies moved, the intergalactic hydrogen moved with them. Andreu Font-Ribera from the Institute of Space Sciences in Barcelona, Spain, created computer models of how the gas likely moved as those clusters formed. The results of his computer models matched well with the map. “That tells us that we really do understand what we’re measuring,” Font-Ribera said. “With that information, we can compare the universe then to the universe now and learn how things have changed.”
“BOSS is the first time anyone has used the Lyman-alpha forest to measure the three-dimensional structure of the universe,” said David Schlegel from Lawrence Berkeley National Laboratory in California. “With any new technique, people are nervous about whether you can really pull it off, but now we’ve shown that we can.” In addition to BOSS, Schlegel noted, the new mapping technique can be applied to future, still more ambitious surveys, like its proposed successor BigBOSS.
When BOSS observations are completed in 2014, astronomers can make a map 10 times larger than the one being released today, according to Patrick McDonald from Lawrence Berkeley National Laboratory and Brookhaven National Laboratory, who pioneered techniques for measuring the universe with the Lyman-alpha forest and helped design the BOSS quasar survey. BOSS’s ultimate goal is to use subtle features in maps like Slosar’s to study how the expansion of the universe has changed during its history. “By the time BOSS ends, we will be able to measure how fast the universe was expanding 11 billion years ago with an accuracy of a couple of percent. Considering that no one has ever measured the cosmic expansion rate so far back in time, that’s a pretty astonishing prospect.”
Quasar expert Patrick Petitjean from the Institut d’Astrophysique de Paris is looking forward to the continuing flood of BOSS data. “14,000 quasars down, 140,000 to go,” he said. “If BOSS finds them, we’ll be happy to look at them all, one by one. With that much data, we’re bound to find things that we never expected.”