“For the first time, we are not only visualizing the detailed structure of our Local Supercluster of galaxies but we are seeing how the structure developed over the history of the universe,” said co-author Brent Tully from the University of Hawaii Institute for Astronomy in a press release. “An analogy is the study of the current geography of the Earth from the movement of plate tectonics.”
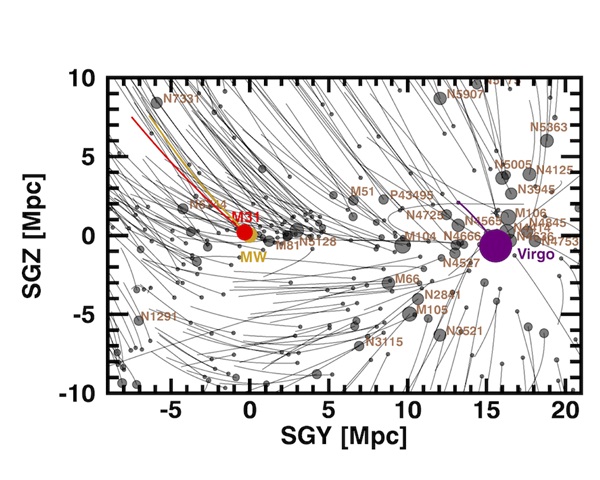
This visualization of the trajectories of nearly all galaxies, groups, and clusters in the Local Supercluster was constructed in a Numerical Action Method (NAM) model and constrained by distance measurements to 18,000 galaxies. The Milky Way and Andromeda (M31) galaxies are shown by smaller spheres colored yellow and green, respectively. The Virgo, Fornax, Antlia, and Virgo W clusters are represented by large spheres colored red, khaki, black, and purple, respectively. Others are colored blue. The time evolution runs from the past 13.25 billion years to present.
Action Dynamics of the Local Supercluster from Daniel Pomarède on Vimeo.
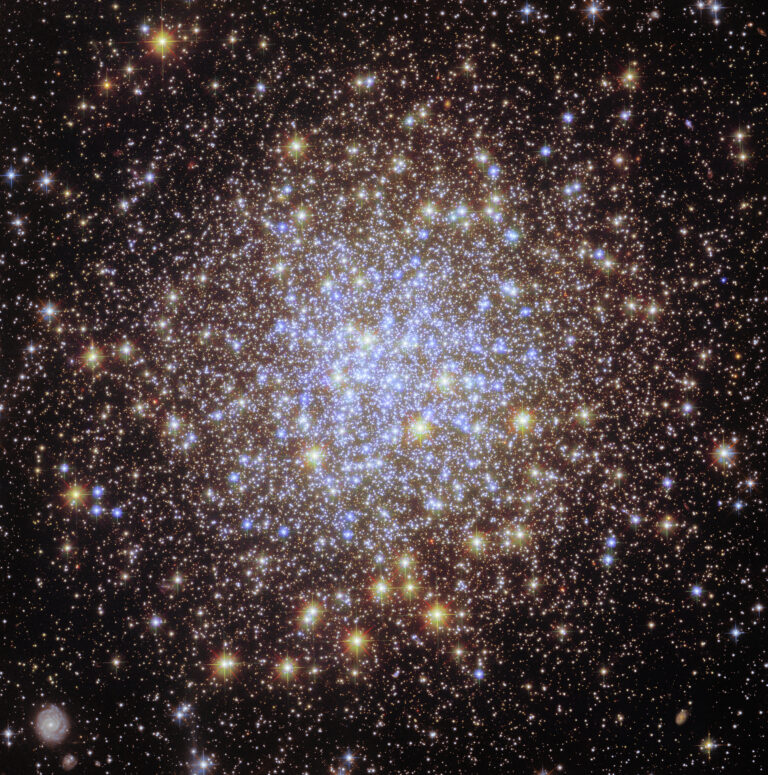
The three-dimensional map, which also comes in both video and interactive versions, shows that many of the galaxies’ motions are primarily influenced by one main gravitational attractor: The Virgo Cluster. This massive collection of galaxies — located some 50 million light-years away in the constellation Virgo (the Maiden) — contains around 1,500 member galaxies and has a mass 600 trillion times that of the Sun.
Over the course of the past 13 billion years, more than a thousand galaxies have become gravitationally bound to the Virgo Cluster, meaning they are forever trapped in an orbital dance around a common center of mass. Furthermore, any galaxy currently within 40 million light-years of the Virgo Cluster will eventually be captured as well. Fortunately, our Milky Way galaxy lies just 10 million light-years beyond this galactic no-fly zone; however, we will merge with the Andromeda galaxy (M31) in about 5 billion years.
Based on the dynamic map, researchers identified two main flow patterns within our extended galactic neighborhood. First, all of the galaxies in the “top” hemisphere of the map (which includes our Milky Way) are flowing downward relatively quickly, away from an underpopulated region known as the Local Void. Second, in addition to nearly all of the galaxies being drawn toward the main gravitational attractor (the Virgo Cluster), many from the “top” hemisphere also seem to be drawn toward a single flat sheet around the Virgo Cluster, almost as if forming an orbital plane.