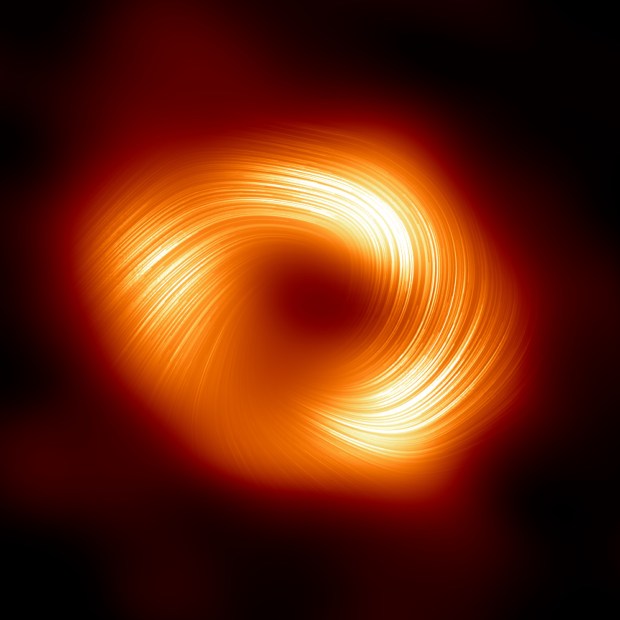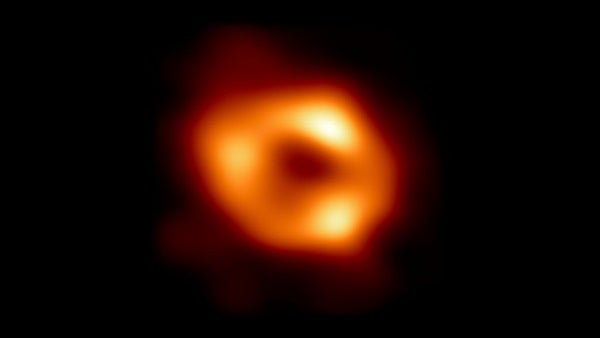
Last week, the Event Horizon Telescope (EHT) collaboration delivered its second stunning and haunting image of the accretion disk around a black hole. And this time, the picture captured Sagittarius A* (Sgr A*), the supermassive black hole that lurks at the heart of our own Milky Way galaxy.
Despite being released in 2022, the EHT collaboration collected the data for this historic shot back in 2017. But why did it take them a half-decade to process the data and generate a final image? The answer is that this type of astronomy is hard — very hard.
Basics of interferometry
The first step to generating an image of Sgr A* is to build a telescope capable of seeing it. But no single instrument has the resolving power necessary to capture the accretion disk around our supermassive black hole, let alone its event horizon. That’s why astronomers often turn to a trick called interferometry to boost the resolution of hard-to-image targets. By using multiple telescopes in tandem, they can combine the data from each. And the farther apart the individual telescopes, the greater resolution they can ultimately achieve.
Of course, the boost in resolution provided by interferometry comes at a cost. For starters, you lose a lot of potential data — photons that strike the ground between the telescopes can’t be used in your analysis. You can partially overcome this challenge by adding more telescopes to the interferometer network and by observing over the course of hours, letting the natural rotation of the Earth help your telescopes cover more ground.
Interferometers also require a massive amount of data processing, as astronomers must correlate together all the individual data streams from each telescope. For most interferometers, like the Very Large Array in New Mexico or the Atacama Large Millimeter/submillimeter Array in Chile, this is achieved by simply connecting the telescopes together with physical cables into a central processing correlator. But for a globe-spanning interferometer like EHT, that hardwired approach isn’t possible.
Event Horizon Telescope: A global scope
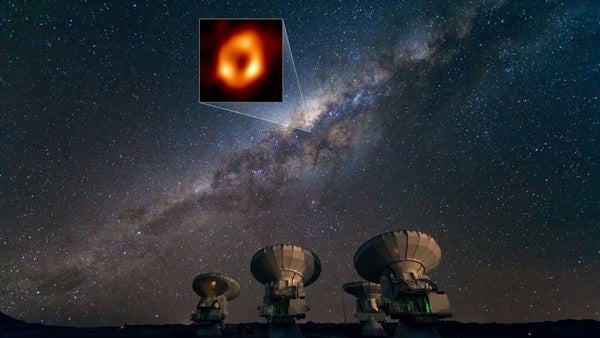
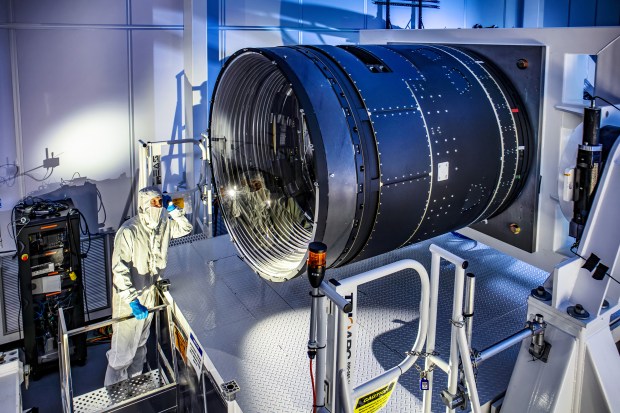
To achieve the resolution required to image the Milky Way’s supermassive black hole, the Event Horizon Telescope needed to span the width of our entire planet, employing telescopes in North America, South America, Europe, and Antarctica. Without any physical cabling, the EHT team had to record every single bit collected by the telescopes during the observing run, sampling the data up to 64 billion times per second.
Each observing run, which typically ran for only a few days, generated a truly enormous amount of data. The team stored the data from each telescope on a set of hard drives, which they then had to physically transport to the MIT Haystack Observatory and the Max Planck Institute for Radio Astronomy for processing.
Another delay came from every astronomer’s enemy: the atmosphere. While our atmosphere is great for providing the air we need to live, it’s terrible for observing. Significant weather events, or even just basic clouds, can totally ruin a planned observing run. The EHT team had to monitor the weather forecasts at each of their telescopes’ locations scattered around the world, waiting for the right time to use all the instruments at once.
For Sagittarius A*, that moment came in April of 2017.
The devil in the details
Once the observations were complete and the physical data storage drives were safely returned to the two headquarters, it was time to process everything. And that’s when calibration became key.
When astronomers point their instruments at a new object, like Sgr A*, they don’t initially know whether they’re seeing light emitted from their target or some other source of contamination.
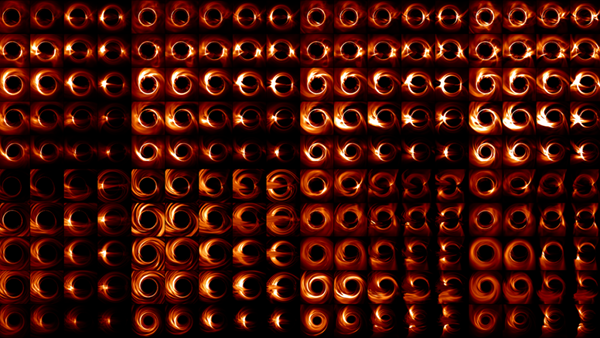
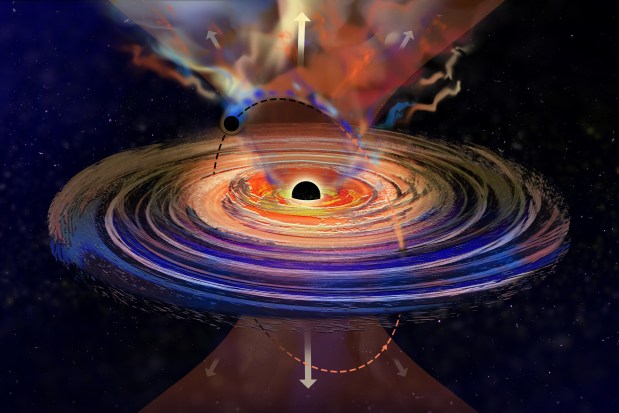
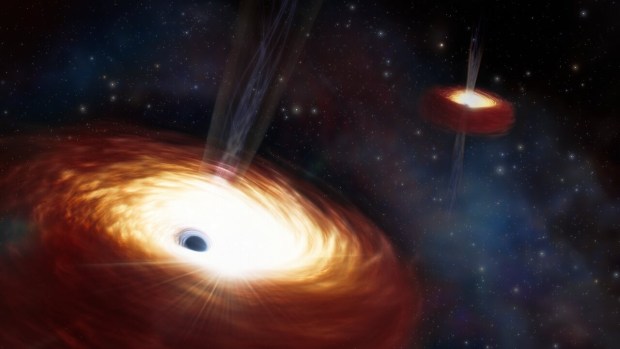
Using ray tracing and Einstein’s theory of general relativity, the EHT team created numerous depictions of what the Milky Way’s supermassive black hole, Sagittarius A*, might look like.
The first common source of contamination is the atmosphere itself (yes, again). There is more than 60 miles (100 kilometers) of air between us and the vacuum of space, and it is constantly shifting, with pockets of warm and cool air competing for dominance. Every time the atmosphere shifts, it slightly changes our view of celestial targets.
To account for this, the EHT team dedicated a fraction of each observing run to training their instruments on a well-known radio source. They then used observed variations in that source to create a real-time model of atmospheric turbulence and its effect on the Sgr A* data, allowing them to remove any atmospheric distortions.
Beyond the atmosphere, there is also a lot of galactic material between us and Sagittarius A* — about 26,000 light-years’ worth. And while interstellar space is almost a vacuum, it isn’t perfectly so, meaning dust grains throughout the galaxy interfere with the radio emissions picked up by the Event Horizon Telescope.
One effect of that dust is to gently scatter the radio waves coming from Sgr A*, making it appear broader than it really is. The second effect is that large, random clumps of interstellar dust introduce small blotches that aren’t a part of the black hole system at all. That meant the team had to work hard to develop models of those effects before they could likewise subtract the from the final image of our home galaxy’s black hole.
Lastly, astronomers had to consider the inherent variability present in the disk surrounding Sagittarius A* itself. Previous, much lower-resolution observations suggested that our supermassive black hole’s disk can double in brightness over the course of only a few years or less. Astronomers have even caught the occasional flare popping up around the black hole and disappearing within a single day.
The EHT team needed to train their telescopes on Sgr A* for several hours. They required all that data to ensure the signal clearly rose above the noise — otherwise, the observation would be so noisy it would be nearly useless. But because the black hole’s disk changed and varied in brightness over all that time, it was like taking a picture of a dog chasing its tail. The team couldn’t simply combine several hours’ worth of data into a single blurry mess.
To tackle this, the team divided the data stream into small chunks, no longer than a few minutes each. They then processed each chunk separately, then combined all the clean chunks together to make a single, average image. As a self-check for consistency, the team used separate software pipelines with different methods for cleaning and processing the data.
The end result of all this work — after years of preparation, days of observation, and years of analysis — is a gorgeous portrait of the gravitational goliath hiding in the center of our galaxy: Sagittarius A*.