The discoveries of a gigantic energy buildup bring scientists a step closer to predicting when and where large flares will occur, which is crucial in protecting Earth from potentially devastating space weather.
While solar flares have long been a spectacular reminder of our star’s power, they are also associated with coronal mass ejections (CMEs) — eruptions of solar material with a twisted magnetic structure flying out of the Sun and into interplanetary space.
Space weather such as CMEs has been identified as a significant risk to the United Kingdom’s infrastructure by the UK’s National Risk Register. Late last year, the UK’s MET Office announced it would set up a daily space weather forecast to work with the United States’ Space Weather Prediction Center (SWPC).
Lead author Jaroslav Dudik of the University of Cambridge’s Center for Mathematical Sciences said: “We care about this as during flares we can have CMEs, and sometimes they are sent in our direction. Human civilization is nowadays maintained by technology, and that technology is vulnerable to space weather. Indeed, CMEs can damage satellites and therefore have an enormous financial cost.
“They can also threaten airlines by disturbing the Earth’s magnetic field. Very large flares can even create currents within electricity grids and knock out energy supplies.”
One such event hit Earth before technology was as integrated into human civilization as it is now, but still had a marked effect. In 1859, the Carrington storm made night skies so bright that newspapers could be read as easily as in daylight and telegraph systems caught fire.
Knowing the standard scientific models are right is therefore very important. The standard 3-D model of solar flares has shown that they occur in places where the magnetic field is highly distorted.
In these places, the magnetic field lines can continuously reconnect while slipping and flipping around each other. In doing so, new magnetic structures are created.
Long before the flare, the magnetic field lines are untangled and appear in a smooth arc between two points on the photosphere (the Sun’s visible surface) — areas called field line footpoints.
In a smooth, non-entangled arc, the magnetic energy levels are low, but entanglement will occur naturally as the footpoints move about each other. Their movement is caused as they are jostled from below by powerful convection currents rising and falling beneath the photosphere.
As the movement continues, the entanglement of field lines causes magnetic energy to build up.
Like a group of straight cords that has been twisted, the lines will hold the energy until it becomes too great and then will release it, “straightening” back to the lower energy state.
Co-author Helen Mason of the University of Cambridge said: “You build the stress slowly until a point where they are no longer sustainable. The field lines say they have had enough, and ‘ping,’ they go back to something simple.”
That “ping” creates the solar flare and CME. The word “ping” belies its power of course. Temperatures in the hotspots of the ejection can reach almost 36 million degrees Fahrenheit (20 million degrees Celsius).
The theory remained unconfirmed until Dudik was reviewing footage of the Sun for an unrelated project last year.
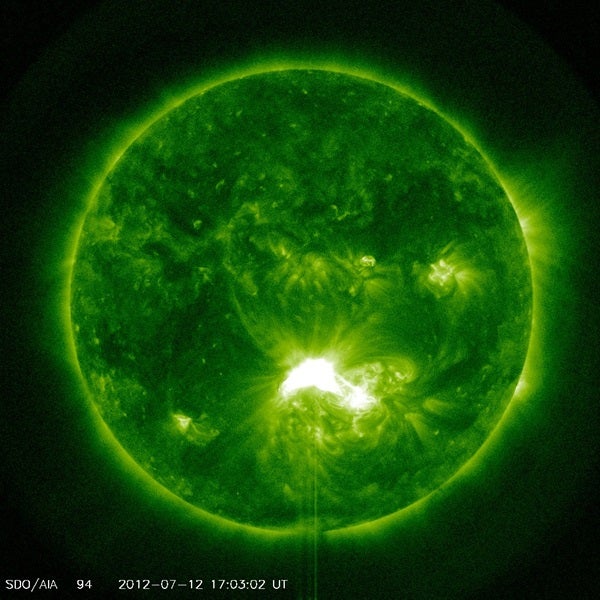
It is no surprise it has taken so long to make the discovery. The technology that created the video is part of the Solar Dynamics Observatory (SDO) satellite mission, which was only launched in 2010 by NASA.
It watches the Sun in the ultraviolet with the Atmospheric Imaging Assembly (AIA) capturing ultra-high-definition images every 12 seconds.
The final piece of the theoretical jigsaw was put in place in 2012 by French scientists — a paper published just six days before the flare occurred. Dudik admits that the serendipity of the discovery is hard to ignore. But in science, fortune favors the prepared: “Suddenly I knew what I was looking at,” he said.
What Dudik witnessed was the ultraviolet dance caused by the magnetic field lines slipping around each other, continuously “unzipping” and reconnecting as the footpoints of the flare loops move around on the surface. But during the flare, the footpoint slipping motion is highly ordered and much faster than the random motions entangling the field before the flare.
Dudik observations were helped by the sheer size of the flare he was looking at — it could encompass 35 Earths. Not only that, the flare was of the most energetic kind, known as an X-class flare, and it took around an hour to reach its maximum.
If it had happened in a smaller flare, the slipping motion might not have been visible, even with NASA’s technology to help.
Although only seen in an X-class flare to date, the mechanism might well be something which happens in all flares, said Dudik: “But we are not yet certain.”
The importance of seeing the evidence of theory cannot be underestimated, said Mason: “In recent years, there have been a lot of developments theoretically, but unless you actually tie that down with observations, you can speculate widely and move further away from the truth, not closer, without knowing it.”