Key Takeaways:
- The Event Horizon Telescope (EHT) successfully utilized a global network of radio observatories and Very Long Baseline Interferometry (VLBI) to capture the first image of a black hole's shadow (M87), with ongoing efforts dedicated to imaging Sagittarius A* (Sgr A*).
- Astronomers, using data from the European Space Agency's Gaia mission and ground-based telescopes, discovered the Radcliffe Wave, a 9,000-light-year-long sinusoidal arrangement of interconnected stellar nurseries, thereby challenging the previously accepted Gould's Belt model.
- These significant astronomical advancements were enabled by technological innovations such as observing at very short radio wavelengths (e.g., 1.3 mm) to penetrate interstellar dust and mitigate blurring, alongside sophisticated data processing and correlation techniques.
- Future research focuses include enhancing black hole imaging resolution by incorporating additional EHT sites and observing at even shorter wavelengths, while investigations into the Radcliffe Wave aim to elucidate its formation mechanisms and dynamic properties within the Milky Way.
A lot can change in a year. First came the photo of an orange-and-black ring swirling in a distant galaxy. It splashed across newspapers worldwide last year, announcing the first-ever image of a black hole. Then, early this year, scientists released a data-based picture of our solar system floating at the edge of a towering wave of dazzling molecular clouds and stellar nurseries. The results smashed a venerable model of our spiral galactic arm.
Stellar nurseries reveal how stars are born, while black holes represent their final annihilation. Based on these two extraordinary pictures, astronomers are now scrambling to refine theories about both. And, in the process, they are ushering in a new way of seeing our Milky Way galaxy.
Tilting at windmills
Supermassive black holes — found at the center of most galaxies — are nature’s portals to cosmic extinction. Einstein reluctantly predicted them and sci-fi writers enthusiastically embrace them.
Acquiring any photo of a black hole has long been considered nearly impossible. To do so required a telescope as big as Earth itself. That telescope was the Event Horizon Telescope (EHT), named for the one-way boundary of a black hole that separates two realities: ours and the unknown.
Within the event horizon, light cannot escape. This means we can never see what’s hiding at the center of the black hole. But we can see the “shadow” of the black hole — a dark central void of light, surrounded by a brilliant ring of gravitationally lensed photons, which are emitted by the hot gas swirling around the black hole. To see that silhouette, the EHT used a network of eight radio observatories around the globe in 2017 to create a virtual Earth-size antenna.
By all accounts, the image EHT produced was groundbreaking. Its subject — the center of M87 — is big enough to envelop our entire solar system. But M87 is far enough away that its black hole matches the apparent size in the sky of our own, smaller black hole, Sagittarius A* (or Sgr A*, pronounced “Sagittarius A-star” or informally “sadge A-star,” with the “star” designating a super-bright radio source). But sitting at Harvard’s Black Hole Initiative (BHI) while his team prepared for another observing campaign this past March, EHT’s founder and director, Shep Doeleman, marveled that his brainchild ever got off the ground.

Afterward, the team discovered that a metal chip had fallen into an antenna’s receiver and corrupted the data. “That was a horrible setback,” Doeleman says.
Doeleman was no stranger to chasing black holes. For his 1995 doctoral thesis at MIT, he focused on Sgr A*, which, at that point, had not yet been definitively identified as a black hole. In the ensuing decade, near-infrared imagery detected several stars moving in tight orbits around Sgr A* at speeds up to 11 million mph (17.7 million km/h), or 1/60 the speed of light. Only the incredibly dense mass of a black hole could explain their motion.
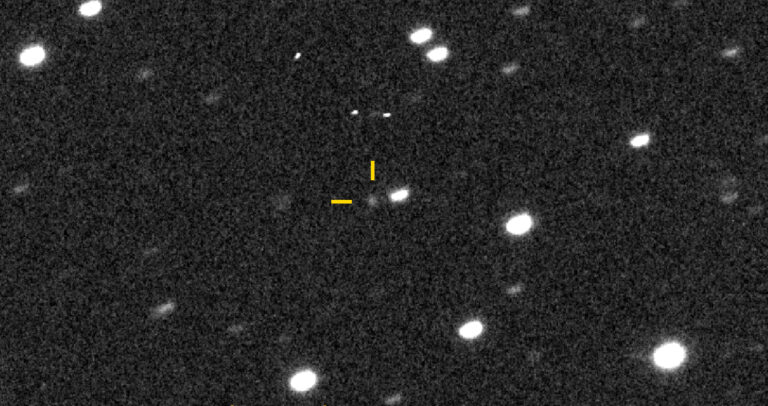
But Doeleman’s obsession was to capture direct proof, not just inferred evidence. In 2007, the team went back and observed Sgr A* again, this time with an additional array in California. Getting right back into observing with the new site was difficult, Doeleman says. But, “that time we were successful, and we were able, using three sites … to measure the size of Sgr A* for the first time.”
They had won a big gamble. Based on the distance between observing sites, the team’s array could make out objects 31 million miles (50 million km) wide. That matched the size of the shadow that Sgr A* should cast, based on its inferred mass. But what if the black hole’s shadow was larger or smaller than that? The team would have seen nothing. As it was, the data showed an unmistakable something right in the middle of Sgr A*, just the right size to be detected, although not resolved. That something had to be the black hole.
Also in 2008, with the same arrays in California, Arizona, and Hawaii, Doeleman proved that the system — a multi-site telescope based on Very Long Baseline Interferometry (VLBI) — worked at the very short wavelengths (1.3 millimeters, rather than the traditional 3.5 mm) needed to image Sgr A*, which has an angular size of only about 20 microarcseconds on the sky. In radio astronomy, observing at shorter wavelengths (higher frequencies) produces higher-resolution, sharper images. That, in turn, allows astronomers to image smaller and smaller objects.
Finally, in 2009, the goose egg turned golden, producing conclusive evidence of a shadow-sized structure in the M87 galaxy in Virgo. The resulting 2012 paper, along with the previously published 2008 results on Sgr A*, clinched the launch of the modern EHT, Doeleman says. “Imagine if we had not made that detection in 2009. I would have spent years of my entire career gaming for this, and we would have been in the soup,” he reflects. “You need people who are willing to risk, in some sense, their career. You need people who are willing to tilt at windmills.”

Targeting two black holes
M87 gave Doeleman’s team a second target. Its supermassive black hole weighs about 6.5 billion Suns, as opposed to Sgr A*, which weighs about 4.5 million Suns. But based on M87’s distance of 55 million light-years, its silhouette is comparable in visual size to Sgr A*, which has a diameter akin to Mercury’s average distance from the Sun, but is over 2,000 times closer, about 26,000 light-years away.
“There are no other [black holes] we know of that present such a large silhouette on the sky,” Doeleman says. “Whenever we went out to observe, we’d observe both of them, because you never know which is going to be the easiest.”
For any successful EHT campaign, all observing locations must simultaneously experience perfect weather. As Earth rotates, consecutive sites pass off duties to maximize observing time. The rotation effectively sweeps the sites across different areas of the virtual dish, enhancing the quality of collected data.
In April 2017, five crystalline nights out of 10 at all six sites — Hawaii, Arizona, Mexico, the South Pole, Spain, and Chile — yielded pristine data on both M87 and Sgr A*. Petabytes of data stored on hard disks from all stations were physically shipped to supercomputers in Boston and Bonn for intense processing and correlation. M87’s black hole emerged the winner — along with Einstein. Predictions of what a black hole would look like, all based on his general theory of relativity, were remarkably similar to what the EHT produced.
By March 2020, there were murmurs at the BHI that a separate image of Sgr A*, based on the 2017 data, might be forthcoming. Although Sgr A* was Doeleman’s original target, it is a restless subject. And, like old-time cameras, the EHT needs its subjects to sit still for a sharp exposure. The plasma whirling around Sgr A* can change shape in a matter of minutes. That makes it hard to photograph. “The fact that Sgr A* moves means we will have to model its motion in order to image its structure — in effect, making a movie,” Doeleman says.
Also complicating matters is the 156 trillion miles (251 trillion kilometers) of material in the Milky Way’s disk that’s between the black hole and Earth. “The intervening gas that lies between us and Sgr A* has a blurring effect (even if Sgr A* were to remain still),” Doeleman explains, “so it’s a separate kind of problem. We get around the blurring largely by observing at higher frequencies where the effects of the blurring decrease.” The team is also developing specialized algorithms designed to further mitigate the smearing effects to create a clear picture.
M87’s black hole, however, is 1,000 times larger and more stable than Sgr A*— too huge to change profile in a single night. If all the stellar-mass black holes detected through gravitational waves were scaled to the size of gumdrops, M87’s black hole would loom next to them as a gaping mouth a mile wide. Next year’s observing campaign may reveal how much M87’s black hole has changed in four years. This year’s observing run was cancelled due to COVID-19.
Cosmic coincidences
A key player in EHT’s success has been electrical engineer Jonathan Weintroub, digital signal processing lead at the Submillimeter Array (SMA) in Hawaii. In 2006, he retrofitted six of the SMA’s eight dishes for shorter wavelengths using supercooled (4 Kelvin) atomic clocks and receivers to create a single virtual dish. Adapting arrays originally designed for 3.5 mm wavelengths to 1.3 mm was crucial because of the need for sharp, high-resolution images.
“There are various absorption lines that render Earth’s atmosphere opaque to radio waves,” says Weintroub. “But there are ‘windows’ in the atmosphere that you can peek through, and the windows happen to be at these preferred wavelengths [of 3.5 mm and 1.3 mm].”
It also happens, Weintroub explains, that by observing at the shorter 1.3 mm wavelength with a telescope one Earth diameter across, the EHT grabs the minimum resolution required to see something the size of Sgr A* in the sky — akin to spotting a softball on the face of the Moon from Earth. One more perk: 1 mm wavelengths not only penetrate the water vapor rampant in Earth’s atmosphere, they also pierce galactic dust particularly well. “As Shep [Doeleman] would say, it’s a cosmic coincidence,” Weintroub says.
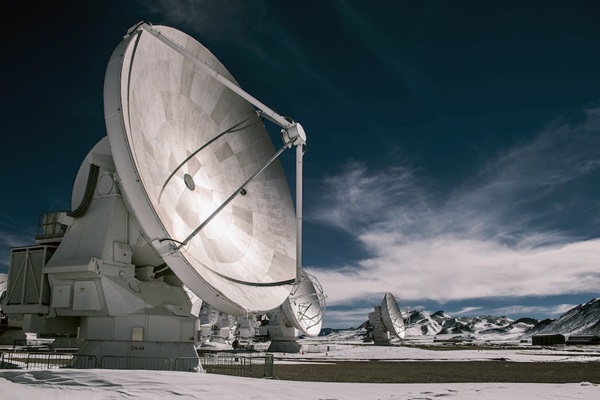
Another fortunate coincidence: Just as Doeleman was ramping up the EHT after his 2009 success, Chile’s Atacama Large Millimeter/submillimeter Array (ALMA) was coming online. It remains the world’s largest radio observatory and was integral to the EHT’s success. “To make the leap from size estimates of these objects to making images, you need a very sensitive, centrally located VLBI site,” Doeleman says.
Doeleman became principal investigator on a project to combine the signals from ALMA’s 64 dishes into one 85-meter virtual dish. Weintroub helped design the system early on. Called the ALMA Phasing Project, it digitally synced sine waves from all dishes into one correlated signal. This is necessary to compensate for minute differences in the time it takes radio waves to arrive at each dish, since each is at a slightly different distance from targets in the sky.
Banking on its success with 1.3 mm observations, the EHT team is now moving to the even shorter wavelength of 0.87 mm (which will improve resolution by 50 percent), with Sgr A* foremost in its sights. Next year, three new sites in Greenland, France, and Arizona — with increased bandwidth and capable of seeing ever shorter wavelengths — will join the existing eight to obtain sharper images. But observing such short wavelengths also pushes radio antennas into a danger zone, where they are more vulnerable to dish surface imperfections, atmospheric aberrations, and receiver limitations. It makes the observations even more challenging.
And even these “short” radio wavelengths are still long compared to, say, infrared, visible, or X-ray light observed by other instruments. “These are very low-energy photons,” Doeleman says, of the light they’re trying to capture. “When the EHT observes Sgr A* for an entire day, all the radio waves we collect have a total energy equivalent to a mosquito landing on your arm.”
Making galactic waves
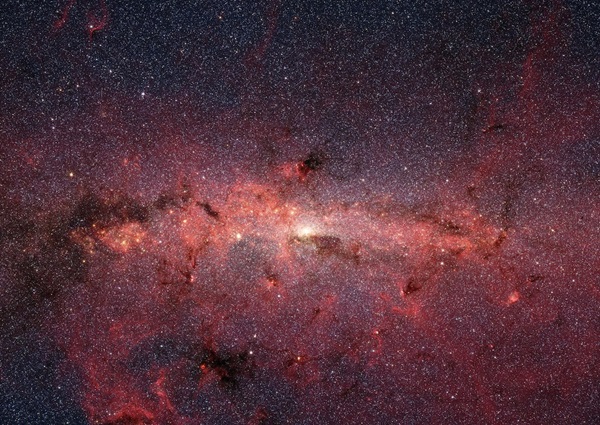
Last year, down the street from the BHI at Harvard’s Radcliffe Institute for Advanced Study and at the Harvard-Smithsonian Center for Astrophysics (CfA), a team of scientists started looking closer to home — in our own spiral arm of the Milky Way.
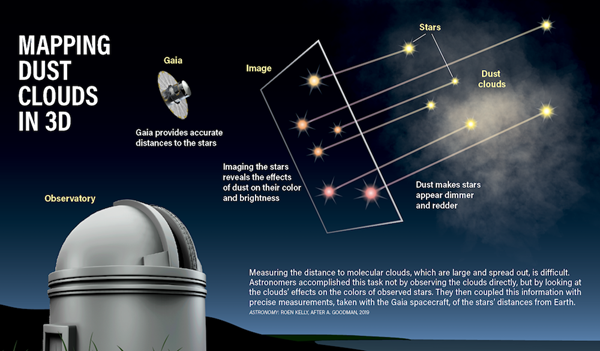
Their prime tool was Gaia, a European Space Agency survey telescope capable of measuring distances and positions of stars with unprecedented accuracy. Spinning in space 930,000 miles (1.5 million km) beyond Earth’s orbit, Gaia is parked at the L2 Lagrange point, where Earth and the Sun’s combined gravity balances the spacecraft’s own orbital centrifugal force.
With an all-sky view of the Milky Way, the SUV-sized instrument uses a collection of mirrors, diffraction gratings, and CCD sensors to measure the distance to more than 1 billion Milky Way stars, about 1 percent of our galaxy’s estimated total. It does so with high-tech precision using a low-tech method devised by the Greek astronomer Hipparchus in 189 B.C. to measure the distance to the Moon: parallax. By measuring each star’s relative position, brightness, and color up to 70 times over the course of its multi-year mission, Gaia is generating an encyclopedic map of the Milky Way.
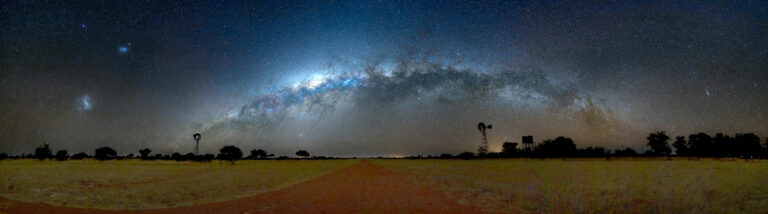
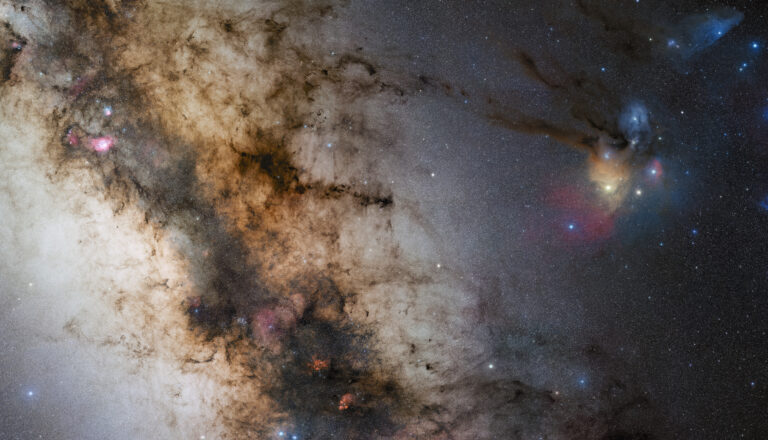
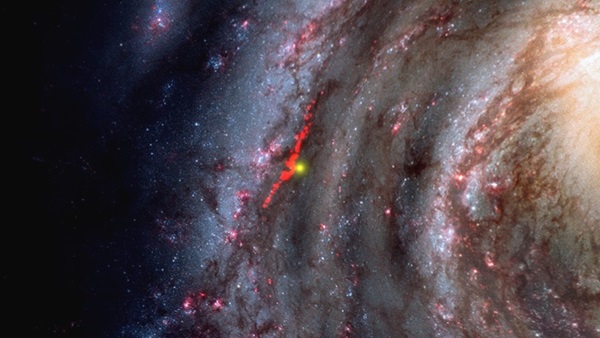
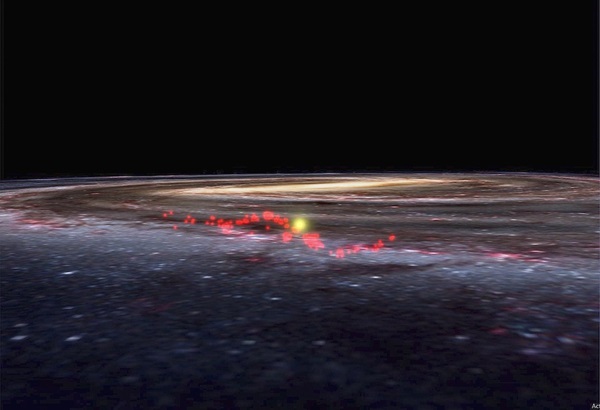
Using recent Gaia data releases, along with observations from ground-based telescopes, the Radcliffe team discovered something extraordinary: a stream of interconnected stellar nurseries snaking in and out of the plane of our galaxy’s spiral-armed disk. Dubbed the Radcliffe Wave, the sinusoidal string of molecular clouds is 9,000 light-years long and 400 light-years wide. It dips some 500 light-years above and below the galactic plane just beyond our solar system, within 500 light-years of the Sun.
Some calculations indicate we may have even “surfed” through the Radcliffe Wave 13 million years ago. “If the Sun were in the wave now, it would look fabulous,” says Harvard University astrophysics professor Alyssa Goodman, who was heavily involved in the project. “All these beautiful nebulae. All the massive star formation going on would be a lot closer and a lot easier to see.”
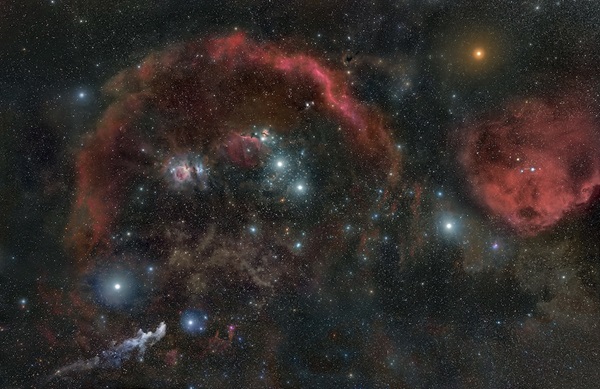
To the chagrin of some traditionalists, the Radcliffe Wave’s discovery has shattered a venerable astronomical model. Called Gould’s Belt, the model envisioned the familiar band of molecular clouds that runs through Orion and neighboring constellations as an expanding ellipse surrounding our solar system. In that visualization, the Sun sat within a ring of star-forming clouds.
A conjunction of art and science
When Alves arrived at Harvard in 2018 as a Radcliffe Fellow with the goal of making a better map of the galaxy, he had Gaia, molecular clouds, and star formation on his mind. Then came a chance encounter with history and art that altered his universe — or, at least, his view of the Milky Way.
At the time, artist Anna Von Mertens was preparing an exhibit of quilts and drawings at the school, based on the historic glass plate night-sky photos used by Henrietta Leavitt, one of Harvard College Observatory’s famous women computers at the turn of the last century. Leavitt’s keen analyses of these plates opened the door to modern astronomy — particularly her discovery of Cepheids, variable stars whose luminosities wax and wane with precise regularity. She recognized that Cepheids with identical periods have the same inherent brightnesses. This meant they could be used as reliable standard candles to measure distances. The discovery, now called Leavitt’s Law, enabled Edwin Hubble to see that the Milky Way is just one of many galaxies inhabiting a much larger, expanding universe.
Von Mertens’ works depict star tracks, the Orion Nebula, and other vestiges of Leavitt’s research. Alves was intrigued. On several occasions he shared with Von Mertens some of the Digitized Sky Survey plates he used as reference. Von Mertens’ quirky questions about them took Alves aback. She would ask him about aspects of the images — such as artifacts — that Alves initially deemed unimportant, he says. “And then I thought, ‘Yeah, why shouldn’t I look at that, too?’ She would always pick things that I would not pick. I was mesmerized by that. I am an observer. I should look at everything, not just what I want to see,” Alves says.
In his own work, Alves wondered whether seemingly disparate star-forming regions in our galaxy might actually be connected. On a flight to Paris, replaying in his mind imagery of the Orion Nebula, and inspired by Von Mertens’ unconventional thinking, he envisioned a “ramp” of material extending from the nebula up into the galactic plane. This ramp, he thought, might link Orion to other molecular clouds. But he needed distance measurements of the clouds to be sure.
Seeing through the clouds
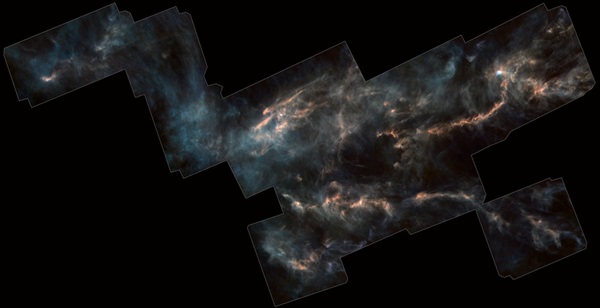
The trouble with molecular clouds is that they are not a single, solid object, but sprawling features made of nebulous gas. That makes it hard to measure the distances to these stellar nurseries.
So, the Radcliffe and CfA team combined Gaia data with star color information from ground-based telescopes, which hold clues about intervening material between Earth and those stars. Molecular clouds cause the stars behind them to appear both dimmer and redder in color than they naturally are (called extinction and reddening, respectively). Catherine Zucker, a Harvard graduate student, spent a year comparing fields of stars reddened by shining through the gas clouds to the bluer stars in front of them. Because the distances to the stars themselves are known, thanks to Gaia, Zucker was able to calculate the distances of the clouds in between. Her published results now serve as the most comprehensive catalog of local molecular cloud positions to date.
“João [Alves] thought that dark lanes [dust clouds] in the sky were connecting Orion and Canis Major,” Zucker recalls. (Canis Major also houses a known star-forming region.) “I was a skeptic.” The concept of wispy gas filaments weaving dense stellar nurseries together in a cohesive structure was radical.
Eventually, Zucker found the distance to every known molecular cloud within 2 kiloparsecs (8,150 light-years) of the Sun and reduced the uncertainty of previous measurements from 30 percent to 5 percent. And among those clouds, an unmistakable sinusoidal wave began to emerge. “When I mapped them, I saw that they fit into this 3D picture of this wave,” Zucker says. “Then I was like, ‘Wow, João [Alves], you’re on to something!’ ”
Goodman, who specializes in computer visualization, mapped the team’s data using software developed at Harvard called “glue.” Another open source mapping suite, called WorldWide Telescope, allowed her to drop Zucker’s 3D map into a larger projection of the Milky Way. “The Radcliffe Wave clouds fit in exactly where the WorldWide Telescope’s data-based illustration already had a hypothetical dark lane [in our spiral arm],” Goodman says. “But it’s much better to see it in 3D and even though most science projects don’t have an ‘Aha!’ moment, you know, the way they do on TV, it was kind of a moment like that.”
Forging ahead
This is only the beginning. Alves believes the Radcliffe Wave may have left its mark on Earth when we last passed through, perhaps in the form of iron-60, a radioactive atomic isotope born in supernovae. But he says spectroscopic methods are not yet able to detect elements far enough in the past to look. Goodman wonders if we can spot similar structures in distant spiral galaxies. And the entire team wonders why the Wave is such a perfect sine wave oscillating above and below the galactic plane, like a plucked string.
Zucker is now calibrating Gaia data with the relative motion of young stars in the stellar nurseries to determine whether the apparent oscillation is real. If it is, what plucked the string? Was it dark matter? Or maybe a collision — a dwarf galaxy smashing through our own? “There has to be some process that accumulates all this gas in this line,” she says. Now, the trick is to find it.
Doeleman’s team is still asking questions about Sgr A* as well. Next spring, EHT will train its giant eye on the heavens once more with a vastly improved network of radio arrays. Its three new sites will substantially multiply the effectiveness of the global array: Doubling the number of telescopes quadruples the number of measurements possible, since VLBI relies on baselines between pairs of telescopes.
The team is already talking about making movies of a black hole or adding a space-based radio telescope to the mix someday. Meanwhile, they are refining Sgr A* data from 2017 and 2018, ramping up for next year and preparing to stun the world again, perhaps this time with a super-sharp snapshot of our very own black hole.
Working with both the infinitesimal and the infinite is inherent to modern astronomy. But whether astronomers are training their eyes on nearby stellar nurseries or faraway black holes, their discoveries can help us better piece together the galaxy in which we live — forever on the inside, looking out.