Atop the historic tower, he stands on a platform that shakes precariously as he leans over to adjust the telescope’s flat mirrors. These track the Sun and reflect its light to the scope’s objective lens, which projects a 17-inch-wide (43 centimeters) image of the solar disk onto a piece of paper on a table in a ground-level observing room below.
Padilla then descends to that room, and begins to sketch the Sun, recording the dark spots spattered across its gilded disk. It’s a ritual that has been observed on nearly every sunny day at Mount Wilson for over 104 years, producing the world’s longest running dataset of sunspots.
This used to be the task of staff astronomers, but in recent years, funding for solar research at Mount Wilson has dried up. Padilla soldiers on as the lone keeper of the flame.

The work is “very interesting,” says Roger Ulrich, the director of Mount Wilson’s 150-foot solar tower. “Their first step is obviously to demonstrate that the method basically works — and they did that. So it would be interesting to see how far they can carry it.”
Deep learning
In the summer of 1612, Galileo Galilei turned his telescope to our closest star, the Sun, projecting its image safely onto a screen. To his surprise, he found the gilded orb was blotted by small dark spots that moved across its face. Although he was not the first to discover such sunspots, his hand-drawn sketches are still some of the earliest surviving drawings of them.
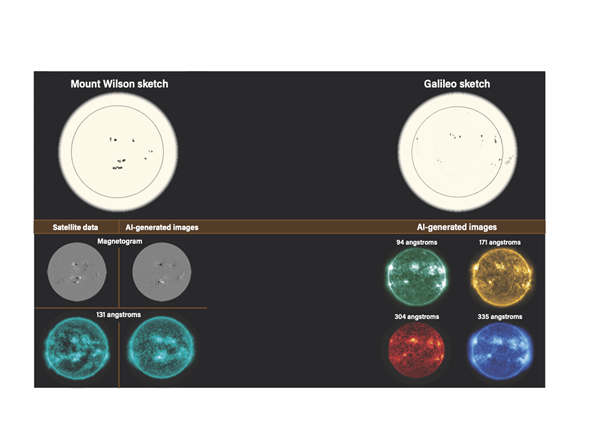
The method the team used to train the AI is called a generative adversarial network. The main algorithm tried to generate artificial images based on the sketches that resembled the real data as closely as it could. Then, a second algorithm acted as a sparring partner, pointing out flaws in the first algorithm’s attempts. After about 210,000 training attempts, the AI was able to produce images and magnetograms that looked markedly similar to the actual observations (at left, right column).
Then, the team deployed the model on historical sunspot sketches. Galileo sketched the image at top right of the Sun’s disk on June 2, 1613. The AI-generated images (at right) represent what a Sun-observing satellite might have seen if it were around in Galileo’s time. Each image corresponds to a different wavelength of light.
The Kyung Hee team set out to create a program that could tease out some of these details, acting as a bridge between historical records and modern satellite observations. To do so, they used a neural network — an algorithm trained on a large amount of data to learn to perform a task. In this case, the researchers wanted to feed the model with sunspot sketches, which capture only the visual appearance of the Sun’s surface. The algorithm would then spit out the kind of images that NASA’s Solar Dynamics Observatory (SDO) satellite might capture in various bands of ultraviolet light, where active sunspot regions glow brilliantly.

“We thought that although sunspot drawings have limited information, if we provide enough data to a deep learning model, it can generate solar images similar to the SDO observation data,” co-authors Harim Lee and Yong-Jae Moon told Astronomy.
Sketching tradition
To provide the model with a training dataset, they turned to the Mount Wilson archives.
The tradition of daily sunspot sketches at the facility dates to Jan. 4, 1917, and persisted even through the rise of photographic plates. While Edwin Hubble was using the 100-inch Hooker telescope across the observatory campus to photograph galaxies and prove that they were “island universes” of their own, hand-drawn sketches remained the method of choice for recording the Sun at the 150-foot solar telescope.

Lee, Moon, and their colleague Eunsu Park took a set of Mount Wilson sketches drawn by Padilla and other observers from 2011 to 2015 and fed them into the algorithm, along with the actual corresponding UV images from SDO. They also provided the model with same-day SDO magnetograms, which are maps of the Sun’s magnetic field strength that indicate the polarity of the field at active regions.
The model, published Feb. 5 in The Astrophysical Journal, generates artificial images that are strikingly similar to the real UV images. And in the generated magnetograms, the team found the model is able to reproduce a characteristic signature of active sunspot regions — side-by-side patches of opposite polarity — even though the model has no knowledge of the physics involved.
Next, they turned their model loose on Galileo’s sketches. Since he made several weeks’ worth of drawings tracking changes in the Sun’s surface, the team was able to use the model to calculate how magnetically active these regions were at the time, how they evolved, and how they would look to modern satellites.
Giving Galileo’s sketches a facelift isn’t the only thing the new model can do. Lee and Moon hope that it can also help them analyze other historically significant solar storms captured in sunspot sketches — like the famous Carrington event of 1859, which created aurorae seen in locales as close to the equator as Cuba. Understanding these massive solar storms has never been more important: Today, they threaten electrical grids, satellites, and even the safety of astronauts.
Long-term payoff
Ulrich hopes this work is the start of something he had long hoped for. “The idea of going back and kind of resurrecting old global magnetogram structures for the Sun has always intrigued me as something that would be valuable,” he says. “The sunspot drawings have some of that information, but obviously not enough of it without this other AI approach.”
One limitation of the model, however, is that it doesn’t reproduce non-active regions of the Sun with weak magnetic fields, which Ulrich says would be necessary to get a comprehensive picture of the Sun’s magnetic field at any given moment, past or present. Though he admits it might not be possible to solve, he says “it certainly would be worth checking out.”
Ulrich and his team were forced to cease research at the 150-foot solar tower in 2012 due to equipment failures and a lack of funding. But he’s gratified to see that their efforts to digitize the records have been useful. “That’s part of why I wanted to get the drawings out there to people,” he says.
In the meantime, Padilla plans to keep living at Mount Wilson and continue his sketches — for as long as he can. The observatory survived a close call with conflagration in the 2019 Bobcat Fire. With the facility nearly consumed by flames, Padilla was forced to evacuate. “I could see the huge plume of smoke every day,” he says. “In the evening, you could look up and see the red glow of flames burning.”
Then, a few months after he returned, the observatory was shuttered by the COVID-19 pandemic. With the mountaintop bathed in an eerie quiet, Padilla watched bears and other wildlife return. “It was going back to a more natural state,” he says.
All the while, he continued his daily routine of opening up the solar telescope and sketching the Sun. “That was a good thing for me in the midst of the pandemic,” says Padilla. “It gave me something to persevere with.”