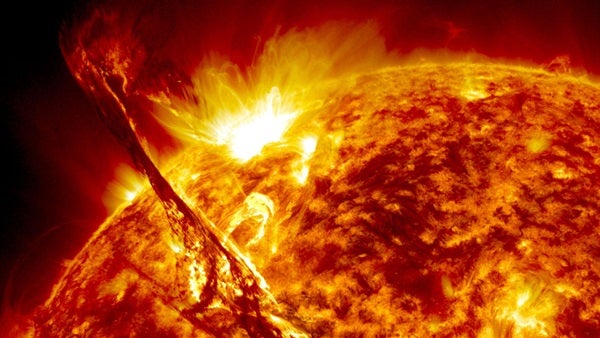
These eruptions on the Sun eject radiation in all directions. The strongest solar flares can impact the ionized part of Earth’s atmosphere — the ionosphere — and interfere with our communications systems, like radio and GPS, and also disrupt onboard satellite electronics. Additionally, high-energy particles, including electrons, protons, and heavier ions, are accelerated by solar flares.
Unlike other space weather events, solar flares travel at the speed of light, meaning we get no warning that they’re coming. So scientists want to pin down the processes that create solar flares and even some day predict them before our communications can be interrupted.
“The existence of a current sheet is crucial in all our models of solar flares,” said James McAteer from New Mexico State University in Las Cruces. “So these observations make us much more comfortable that our models are good.”
And better models lead to better forecasting, said Michael Kirk from NASA’s Goddard Space Flight Center in Greenbelt, Maryland. “These complementary observations allowed unprecedented measurements of magnetic reconnection in three dimensions,” Kirk said. “This will help refine how we model and predict the evolution of solar flares.”
Looking at current sheets
A current sheet is a fast flat flow of electrically-charged material, defined in part by its extreme thinness compared to its length and width. Current sheets form when two oppositely aligned magnetic fields come in close contact, creating high magnetic pressure. Electric current flowing through this high-pressure area is squeezed, compressing it down to a fast and thin sheet. It’s a bit like putting your thumb over the opening of a water hose — the water, or in this case the electrical current, is forced out of a tiny opening much faster. This configuration of magnetic fields is unstable, meaning that the same conditions that create current sheets are also ripe for magnetic reconnection.
“Magnetic reconnection happens at the interface of oppositely-aligned magnetic fields,” said Chunming Zhu from New Mexico State University. “The magnetic fields break and reconnect, leading to a transformation of the magnetic energy into heat and light, producing a solar flare.”
Because current sheets are so closely associated with magnetic reconnection, observing a current sheet in such detail backs up the idea that magnetic reconnection is the force behind solar flares.
“You have to be watching at the right time, at the right angle, with the right instruments to see a current sheet,” said McAteer. “It’s hard to get all those ducks in a row.”
This isn’t the first time scientists have observed a current sheet during a solar flare, but this study is unique in that several measurements of the current sheet — such as speed, temperature, density, and size — were observed from more than one angle or derived from more than one method.
This multi-faceted view of the December 2013 flare was made possible by the wealth of instruments aboard three solar-watching missions: NASA’s Solar Dynamics Observatory, NASA’s Solar and Terrestrial Relations Observatory, which has a unique viewing angle on the far side of the Sun, and Hinode, which is a collaboration between the space agencies of Japan, the United States, the United Kingdom, and Europe led by the Japan Aerospace Exploration Agency.
Even when scientists think they’ve spotted something that might be a current sheet in solar data, they can’t be certain without ticking off a long list of attributes. Since this current sheet was so well observed, the team was able to confirm that its temperature, density, and size over the course of the event were consistent with a current sheet.
As scientists work up a better picture of how current sheets and magnetic reconnection lead to solar eruptions, they’ll be able to produce better models of the complex physics happening there, providing us with ever more insight on how our closest star affects space all around us.