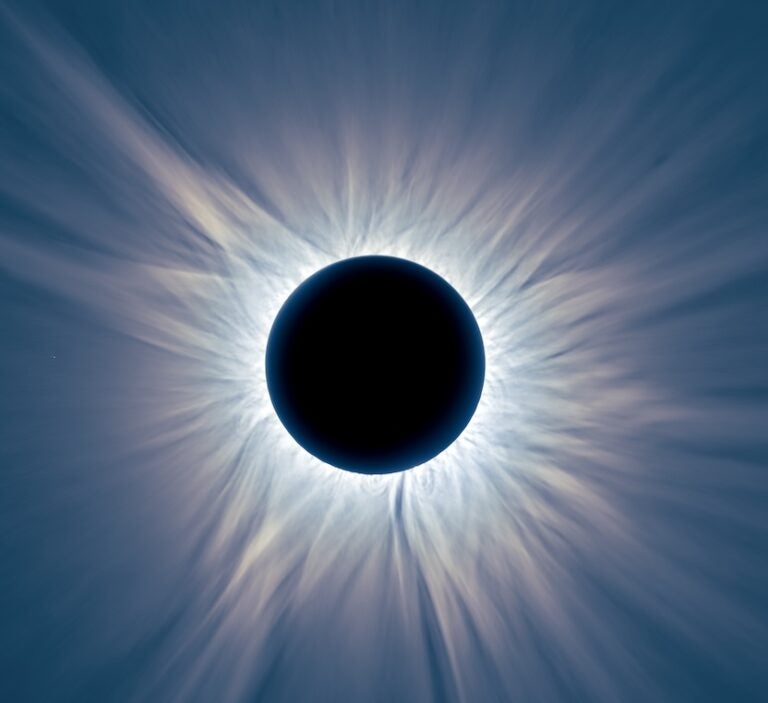
The quasi-annual variations appear to be driven by changes in the bands of strong magnetic fields in each solar hemisphere. These bands also help shape the approximately 11-year solar cycle that is part of a longer cycle that lasts about 22 years.
“What we’re looking at here is a massive driver of solar storms,” said Scott McIntosh from NCAR’s High Altitude Observatory. “By better understanding how these activity bands form in the Sun and cause seasonal instabilities, there’s the potential to greatly improve forecasts of space weather events.”
The overlapping bands are fueled by the rotation of the Sun’s deep interior, according to observations by the research team. As the bands move within the Sun’s northern and southern hemispheres, activity rises to a peak over a period of about 11 months and then begins to wane.
The quasi-annual variations can be likened to regions on Earth that have two seasons, such as a rainy season and a dry season, McIntosh said.
The study can help lead to better predictions of massive geomagnetic storms in Earth’s outer atmosphere that sometimes disrupt satellite operations, communications, power grids, and other technologies.
A “jet stream” in the Sun
The new study is one of a series of papers by the research team that examines the influence of the magnetic bands on several interrelated cycles of solar magnetism. In a paper last year, the authors characterized the approximately 11-year sunspot cycle in terms of two overlapping parallel bands of opposite magnetic polarity that slowly migrate over almost 22 years from high solar latitudes toward the equator, where they meet and terminate.
McIntosh and his co-authors detected the twisted, ring-shaped bands by drawing on a host of NASA satellites and ground-based observatories that gather information on the structure of the Sun and the nature of solar flares and coronal mass ejections (CMEs). These observations revealed the bands in the form of fluctuations in the density of magnetic fuel that rose from the solar interior through a transition region known as the tachocline and on to the surface where they correlated with changes in flares and CMEs.
In the new paper, the authors conclude that the migrating bands produce seasonal variations in solar activity, which are as strong as the more familiar 11-year counterpart. These quasi-annual variations take place separately in both the northern and southern hemispheres.
“Much like Earth’s jet stream, whose warps and waves have had severe impact on our regional weather patterns in the past couple of winters, the bands on the Sun have very slow-moving waves that can expand and warp it, too,” said Robert Leamon from Montana State University. “Sometimes this results in magnetic fields leaking from one band to the other. In other cases, the warp drags magnetic fields from deep in the solar interior, near the tachocline, and pushes them toward the surface.”
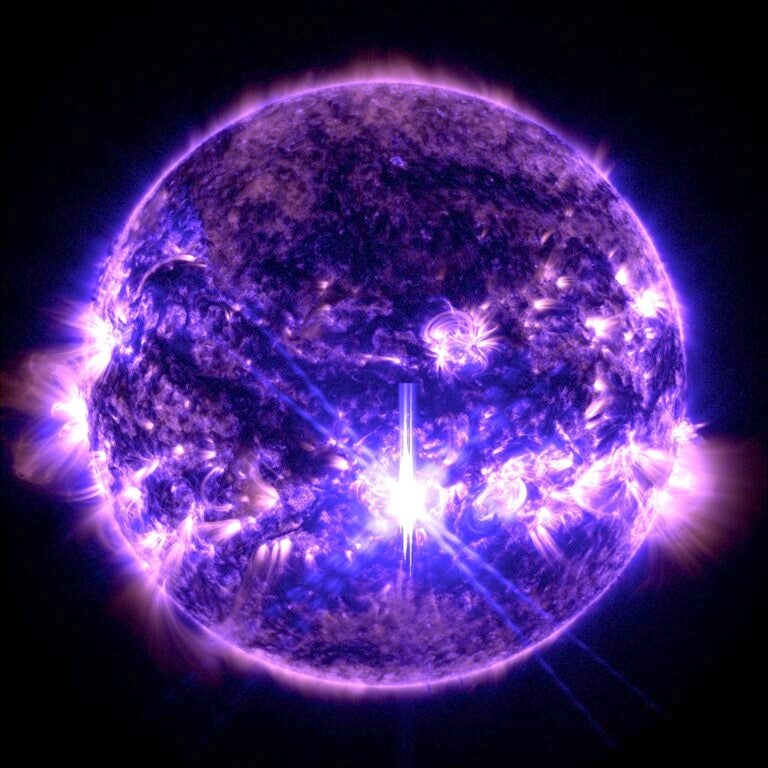
The surges of magnetic fuel from the Sun’s interior catastrophically destabilize the corona, our star’s outermost atmosphere. They are the driving force behind the most destructive solar storms.
“These surges, or ‘whomps’ as we have dubbed them, are responsible for over 95 percent of the large flares and CMEs — the ones that are really devastating,” McIntosh said.
The quasi-annual variability can also help explain a Cold War era puzzle: Why do powerful solar flares and CMEs often peak a year or more after the maximum number of sunspots? This lag is known as the Gnevyshev Gap, after the Soviet scientist who first reported it in the 1940s. The answer appears to be that seasonal changes may cause an upswing in solar disturbances long after the peak in the solar cycle.
Researchers can turn to advanced computer simulations and more detailed observations to learn more about the profound influence of the bands on solar activity. McIntosh said this could be assisted by a proposed network of satellites observing the Sun, much as the global networks of satellites around Earth have helped advance terrestrial weather models since the 1960s.
“If you understand what the patterns of solar activity are telling you, you’ll know whether we’re in the stormy phase or the quiet phase in each hemisphere,” McIntosh said. “If we can combine these pieces of information, forecast skill goes through the roof.”


