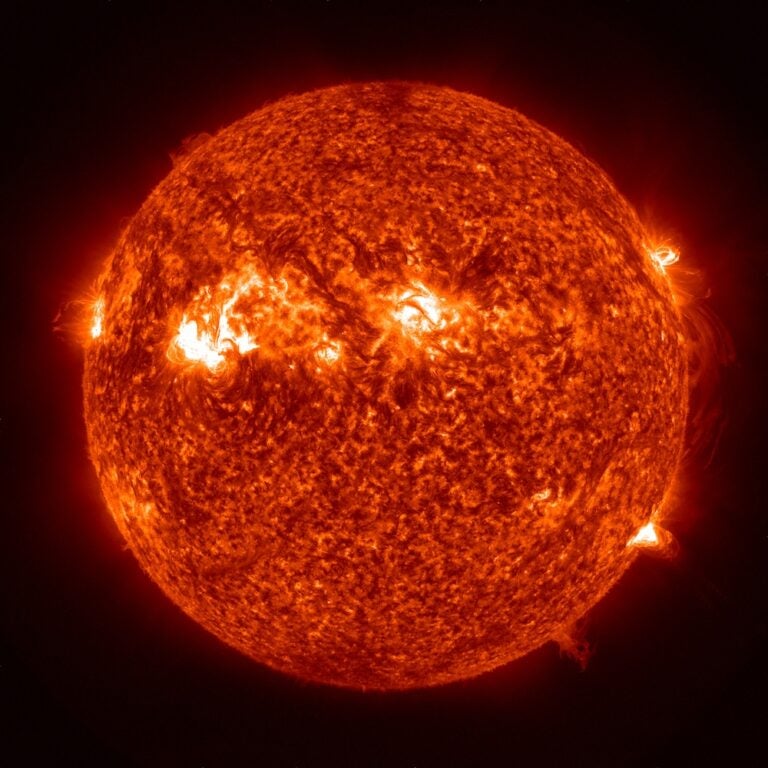
The Sun’s surface dances. Giant loops of magnetized solar material burst up, twist, and fall back down. Some erupt, shooting radiation flares and particles out into space. Forced to observe this dance from afar, scientists use all the tools at their disposal to look for patterns and connections to discover what causes these great explosions. Mapping these patterns could help scientists predict the onset of space weather that bursts toward Earth from the Sun, interfering with communications and Global Positioning System (GPS) signals.
Analysis of 191 solar flares since May 2010 by NASA’s Solar Dynamics Observatory (SDO) has recently shown a new piece in the pattern: some 15 percent of the flares have a distinct “late phase flare” some minutes to hours later that has never before been fully observed. This late phase of the flare pumps much more energy out into space than previously realized.
“We’re starting to see all sorts of new things,” said Phil Chamberlin, deputy project scientist for SDO at NASA’s Goddard Space Flight Center in Greenbelt, Maryland. “We see a large increase in emissions a half-hour to several hours later that is sometimes even larger than the original, traditional phases of the flare. In one case on November 3, 2010, measuring only the effects of the main flare would mean underestimating the amount of energy shooting into Earth’s atmosphere by 70 percent.”
The entire space weather system, from the Sun’s surface to the outer edges of the solar system, is dependent on how energy transfers from one event to another — magnetic reconnection near the Sun transferred, to movement energy barreling across space, to energy deposited into Earth’s atmosphere, for example. Better understanding of this late phase flare will help scientists quantify just how much energy is produced when the Sun erupts.
The team found evidence for these late phases when SDO first began collecting data in May 2010 and the Sun decided to put on a show. In that very first week, in the midst of an otherwise fairly quiet time for the Sun, there sprouted some nine flares of varying sizes. Flare sizes are divided into categories, named A, B, C, M, and X, that have long been defined by the intensity of the X-rays emitted at the flare’s peak as measured by the GOES (Geostationary Operational Environmental Satellite) satellite system. GOES is a NOAA-operated network of satellites that has been in geosynchronous orbit near Earth since 1976. One of the GOES satellites measures only X-ray emissions and is a crucial source of information on space weather that the Sun sends our way.
That May 2010, however, SDO observed those flares with its multiwavelength vision. It recorded data indicating that some other wavelengths of light weren’t behaving in sync with the X-rays, but peaked at other times.
“For decades, our standard for flares has been to watch the X-rays and see when they peak,” said Tom Woods, a space scientist at the University of Colorado, Boulder. “That’s our definition for when a flare goes off. But we were seeing peaks that didn’t correspond to the X-rays.”
Woods said that at first they were worried the data were an anomaly or a glitch in the instruments. But as they confirmed the data with other instruments and watched the patterns repeat over many months, they began to trust what they were seeing. “And then we got excited,” he said.
Over the course of a year, the team used the Extreme ultraviolet Variability Experiment (EVE) instrument on SDO to record data from many more flares. EVE doesn’t snap conventional images. Woods is the principal investigator for the EVE instrument, and he explains that it collects all the light from the Sun at once and then precisely separates each wavelength of light and measures its intensity. This doesn’t produce pretty pictures the way other instruments on SDO do, but it provides graphs that map out how each wavelength of light gets stronger, peaks, and diminishes over time. EVE collects this data every 10 seconds, a rate guaranteed to provide brand new information about how the Sun changes, given that previous instruments only measured such information every 1.5 hours or didn’t look at all the wavelengths simultaneously — not nearly enough information to get a complete picture of the heating and cooling of the flare.
Recording extreme ultraviolet light, the EVE spectra showed four phases in an average flare’s lifetime. The first three have been observed and are well-established (though EVE was able to measure and quantify them over a wide range of light wavelengths better than has ever been done). The first phase is the hard X-ray impulsive phase, in which highly energetic particles in the Sun’s atmosphere rain down toward the solar surface after an explosive event in the atmosphere known as magnetic reconnection. They fall freely for some seconds to minutes until they hit the denser lower atmosphere, and then the second phase, the gradual phase, begins. Over the course of minutes to hours, the solar material, called plasma, is heated and explodes back up, tracing its way along giant magnetic loops, filling the loops with plasma. This process sends off so much light and radiation that it can be compared to millions of hydrogen bombs.
The third phase is characterized by the sun’s atmosphere — the corona — losing brightness, and so is known as the coronal dimming phase. This is often associated with what’s known as a coronal mass ejection, in which a great cloud of plasma erupts off the surface of the Sun.
But the fourth phase, the late phase flare, spotted by EVE was new. Anywhere from 1 to 5 hours later for several of the flares, scientists saw a second peak of warm coronal material that didn’t correspond to another X-ray burst.
“Many observations have spotted an increased extreme ultraviolet peak just seconds to minutes after the main phase of the flare, and this behavior is considered a normal part of the flare process. But this late phase is different,” said Chamberlin. “These emissions happen substantially later. And it happens after the main flare exhibits that initial peak.”
To try to understand what was happening, the team looked at the images collected from SDO’s Advanced Imaging Assembly (AIA) as well. They could see the main phase flare eruption in the images and also noticed a second set of coronal loops far above the original flare site. These extra loops were longer and became brighter later than the original set (or the post-flare loops that appeared just minutes after that). These loops were also physically set apart from those earlier ones.
“The intensity we’re recording in those late phase flares is usually dimmer than the X-ray intensity,” said Woods. “But the late phase goes on much longer, sometimes for multiple hours, so it’s putting out just as much total energy as the main flare that typically only lasts for a few minutes.” Because this previously unrealized extra source of energy from the flare is equally important to impacting Earth’s atmosphere, Woods and his colleagues are now studying how the late phase flares can influence space weather.
The late phase flare is, of course, just one piece of the puzzle as scientists try to understand our star. But keeping track of the energy, measuring all the different wavelengths of light, and using all the instruments NASA has at its disposal helps astronomers map out all the steps of the Sun’s great dance.


