Key Takeaways:
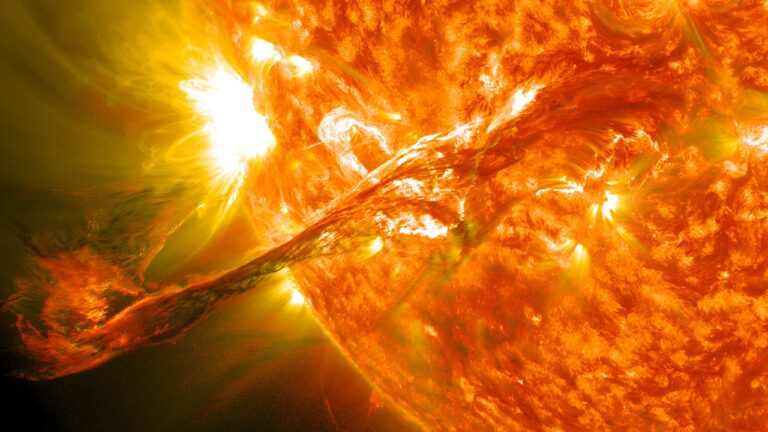
This image from NASA’s Solar Dynamics Observatory shows the Sun in extreme ultraviolet (UV) light at a wavelength of 171 angstroms. Active sunspot regions appear bright in UV light as the Sun’s twisted magnetic field heats its upper atmosphere.
In the summer of 1612, Galileo Galilei turned his telescope to our closest star, the Sun, projecting its image safely onto a screen. To his surprise, he found its surface was blotted by small dark spots that moved across its face. Although he was not the first to discover such sunspots, his hand-drawn sketches are still some of the earliest surviving drawings of them.
Today, of course, astronomers have much more advanced methods for observing the Sun. Ground-based and satellite imagery captures the Sun in multiple wavelengths, revealing the complex structures of its sunspot-creating magnetic field — details that would have eluded Galileo and his visual observations.
But now, thanks to the artificial intelligence deep learning — as well as a long-running campaign of hand-drawn solar sketches that continues in California to this day — a team of scientists at Kyung Hee University in Seoul, South Korea, have reconstructed what Galileo’s Sun would have looked like if it were observed by modern satellites. The AI-generated images are not perfect, but they still could be used to glean information about the strength of the Sun’s magnetic field in those sketched regions hundreds of years ago.
The work was published in The Astrophysical Journal on February 5.
Deep learning tackles Sun sketches
The model they created is a neural network — an algorithm that is trained on a large amount of data to learn the task it is supposed to perform. In this case, the Kyung Hee team wanted to feed the model sunspot sketches, which capture only the visual appearance of the Sun’s surface. The algorithm would then spit out the kind of images that NASA’s Solar Dynamics Observatory (SDO) satellite would capture of such sketches in various bands of ultraviolet light, where active sunspot regions glow brilliantly.
Those kinds of images can reveal information about the state of the Sun’s magnetic field. That’s because unlike the relatively simple magnetic field of the Earth, which more or less resembles that of a planet-sized bar magnet, the Sun’s magnetic field is a complex mess of looped and knotted strands that arc above the star’s visible surface. The energy trapped in these twisted magnetic field lines creates sunspots on the Sun’s visible surface by suppressing energy welling up from within. This makes those areas cooler and, therefore, darker in visible light. But it also serves to heat gas high in the Sun’s atmosphere, creating the scorching, glowing areas seen in UV images.
“We thought that although sunspot drawings have limited information, if we provide enough data to a deep learning model, it can generate solar images similar to the SDO observation data,” co-authors Harim Lee and Yong-Jae Moon told Astronomy in an email.
Enhance: Hand-drawn Galileo sketches
In order to provide the model with a training dataset, they turned to the archives of Mount Wilson Observatory outside of Los Angeles. There, on nearly every clear day since the observatory’s historic 150-foot-tall (46 meter) solar observing tower opened in 1912, an observer makes a hand-drawn sunspot sketch.
Lee, Moon, and their colleague Eunsu Park took the sketches made from 2011 to 2015 and feed them into the algorithm, along with the actual corresponding UV images from SDO. They also provided the model with SDO magnetograms, which are maps of the Sun’s magnetic field strength that indicate the polarity of the field at active regions.
The resulting model manages to generate UV images that are striking in their similarity to the real deal. And in the generated magnetograms, the model reproduces a characteristic signature of active sunspot regions — side-by-side patches of opposite polarity — even though the model has no knowledge of the physics involved.
Since Galileo made several weeks’ worth of sketches tracking changes in the Sun’s surface, the team was able to use the model to calculate how magnetically active these regions were at the time, how they evolved, and how they would look to modern satellites.
But giving Galileo’s sketches a facelift isn’t the only thing the new model can do. Lee and Moon hope that it can also help them analyze other historically significant solar storms captured in other sunspot sketches — like the Carrington event of 1859 — acting as a bridge between historical records and modern satellite observations.
A long effort finally paying off
The work is “very interesting,” says Roger Ulrich, the director of Mount Wilson’s the 150 foot solar tower. “Their first step is obviously to demonstrate that the method basically works — and they did that. So it would be interesting to see how far they can carry it.”
For Ulrich, this work is the start of something he has long hoped would come from he and his staff’s efforts to maintain and digitize the sunspot sketch archive. “The idea of going back and kind of resurrecting old global magnetogram structures for the Sun has always intrigued me as something that would be valuable,” he says. “The sunspot drawings have some of that information, but obviously not enough of it without this other AI approach.”
One limitation of the model, however, is that it doesn’t reproduce non-active regions of the Sun with weak magnetic fields, which Ulrich says would be necessary to get a comprehensive picture of the Sun’s magnetic field at any given moment, past or present. Though he admits it might not be possible to solve, he adds “it certainly would be worth checking out.”
Unfortunately, Ulrich and his team were forced to cease their research operations at the 150-foot solar tower back in 2012 due to equipment failures and a lack of funding. But a volunteer observer, Steve Padilla, still climbs the tower every clear day to make a sunspot sketch, which is posted online each day. But Ulrich says it’s gratifying to see the digitized data — which go back to 1967 and took about three years to process — be useful.
“That’s part of why I wanted to get the drawings out there to people,” says Ulrich. “I am glad that the availability of the data has helped the community like this.”


